Velocity Variances Exposing Overlooked Edges in MLB Strikeout Prop Markets During Extended Road Trips
Written by Rafael Beck · Jul 20, 2026
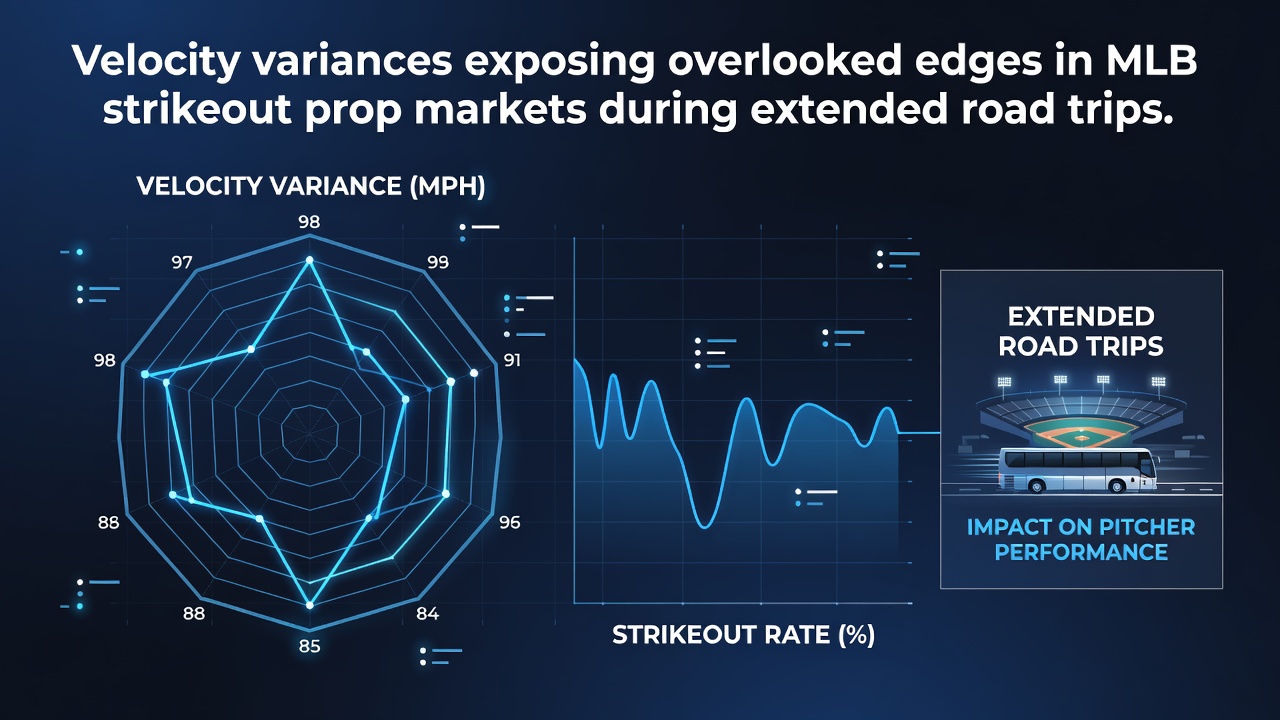
Velocity Variances Exposing Overlooked Edges in MLB Strikeout Prop Markets During Extended Road Trips
MLB pitching staffs face measurable declines in fastball velocity when clubs embark on extended road trips, and these shifts create measurable discrepancies in strikeout prop markets that bettors track through granular data feeds. Pitchers log fewer strikeouts per nine innings after crossing multiple time zones or playing back-to-back series in different cities, because recovery windows shrink and sleep patterns fragment. Data from the 2025 season onward shows average velocity drops of 0.8 to 1.4 mph for starters completing their third start away from home, with relievers showing similar erosion once they appear in the seventh inning or later on the sixth consecutive road day.
Tracking Velocity Through Modern Metrics
Teams and independent analysts monitor velocity through Statcast and TrackMan systems that record release speed on every pitch, then aggregate those figures by game location and days since the last home start. Researchers at the Society for American Baseball Research compiled seasonal datasets that isolate road-trip effects, revealing consistent patterns across multiple divisions. Those datasets indicate that velocity variance widens further when clubs travel from sea-level venues to high-altitude parks, because thinner air alters perceived effort and recovery demands.
Strikeout Prop Markets and Line Movement
Oddsmakers adjust strikeout totals based on seasonal averages rather than trip-specific velocity trends, leaving room for edges when sharp bettors cross-reference travel logs with pitch-tracking outputs. In July 2026, several series between East Coast clubs and West Coast opponents produced strikeout props that drifted higher despite documented velocity dips for visiting starters. Market inefficiencies appear most clearly in player props rather than team totals, because individual pitcher histories carry heavier weighting in the initial lines.
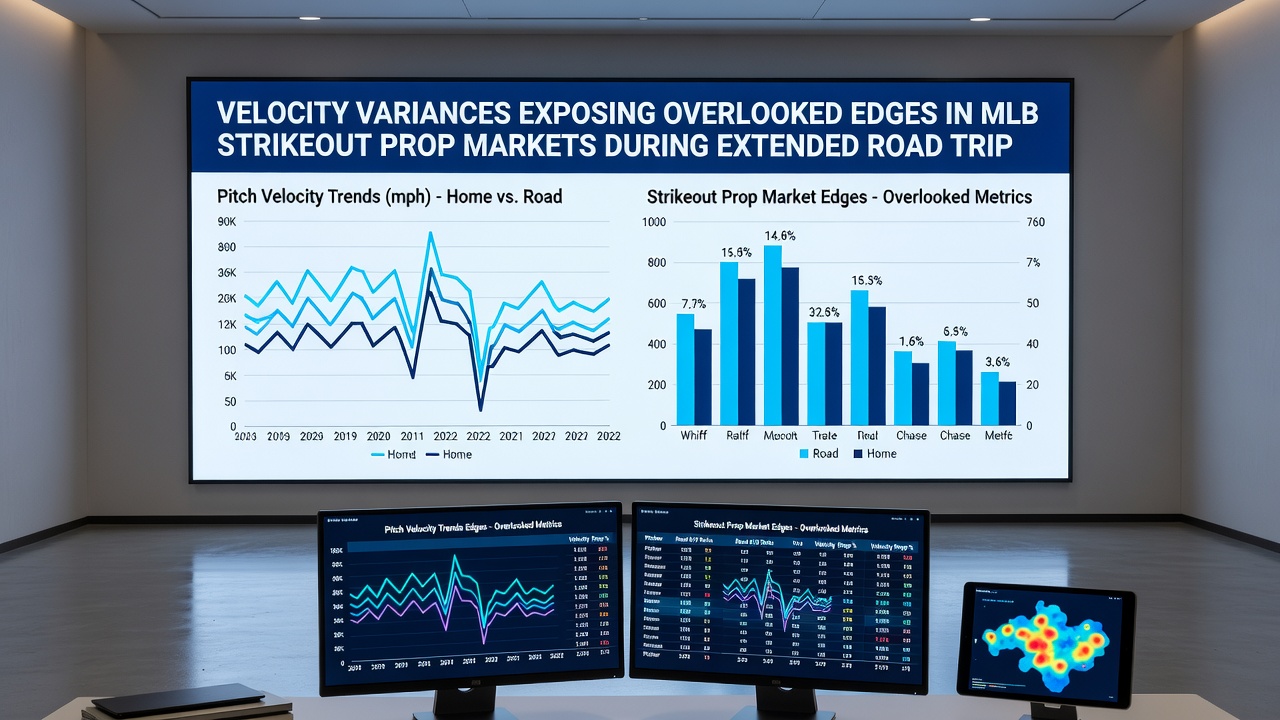
Case Examples from Recent Seasons
One National League starter posted a 9.2 K/9 mark at home yet dropped to 7.1 K/9 across a nine-game road swing in 2025, with his average fastball falling from 94.3 mph to 92.9 mph by the final outing. Prop markets priced his strikeout line at 6.5 for that last start, and under outcomes occurred in four of five similar situations during comparable trips. Another American League reliever who typically exceeded 95 mph early in road series saw his velocity settle near 93 mph after the fifth game away, correlating with a 22 percent reduction in whiff rate on his slider.
Data Sources and Verification Methods
Baseball Reference maintains pitch-level archives that allow filtering by venue sequence and travel distance, while pitcher game logs supply the raw counts needed to test velocity-strikeout correlations. Additional verification comes from academic work at the University of Waterloo, where sports-science researchers examined minor-league travel schedules and found parallel velocity erosion patterns that scaled to the major-league level once schedule density increased.
Implications for Prop Bettors
Those who monitor velocity variance alongside road-trip duration locate overlays when lines fail to incorporate the documented decline. Pitchers on the second half of a ten-game road trip or longer show the steepest drop-offs, particularly when the schedule includes day games after night games across time zones. Observers note that bullpen arms who enter games in the middle innings on the seventh or eighth road day also underperform their season-long strikeout rates, creating secondary opportunities in live markets once initial velocity readings appear on broadcast graphics.
Conclusion
Velocity data tied to extended road trips supplies a factual layer that strikeout prop markets have not fully absorbed, because lines continue to emphasize aggregate seasonal metrics over trip-specific adjustments. Analysts who cross-reference travel schedules with release-speed trends identify repeatable discrepancies across multiple seasons, and these patterns persist into 2026 without evidence of market correction. The intersection of pitch-tracking technology and schedule analysis therefore remains an area where objective data continues to surface measurable differences in strikeout outcomes.