Tracking Seasonal Form Slumps in European Soccer Squads Through Midweek Fixture Clusters
Written by Amir Simon · Jun 13, 2026
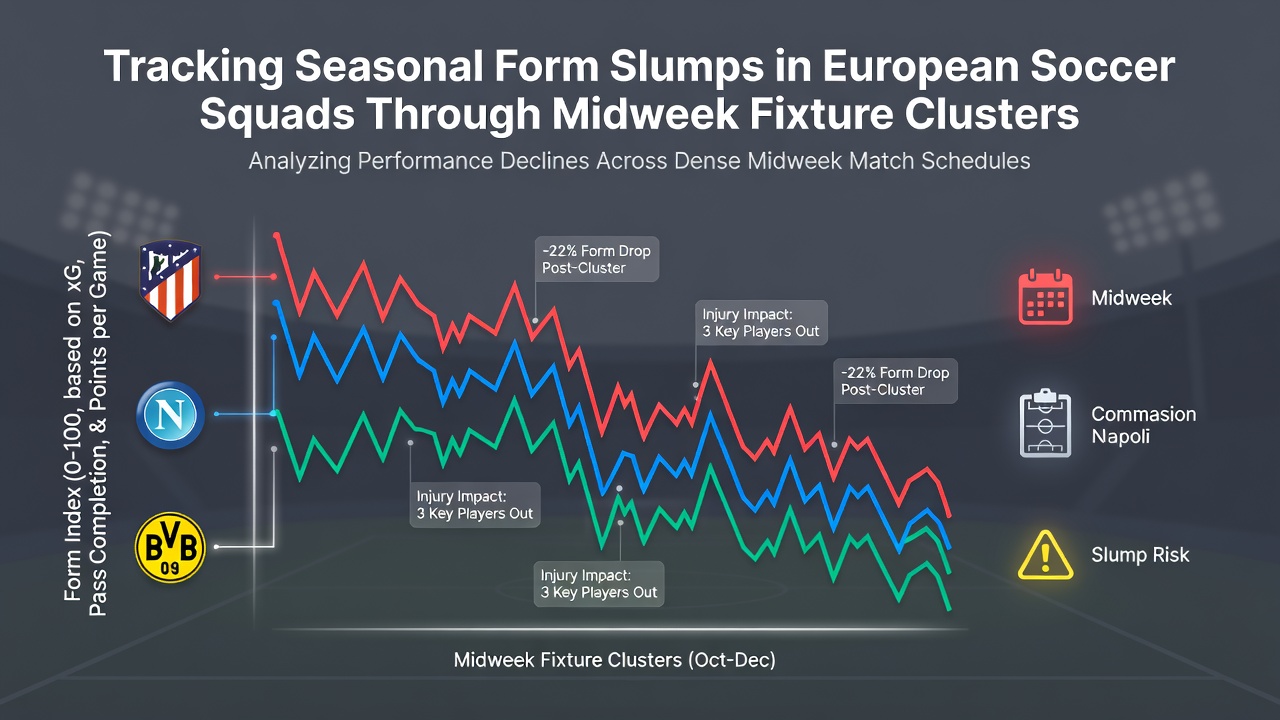
Tracking Seasonal Form Slumps in European Soccer Squads Through Midweek Fixture Clusters
European soccer schedules create recurring patterns where squads face clusters of midweek matches alongside weekend league games, and analysts track how these periods correlate with measurable drops in team performance metrics across a full season. Data from domestic leagues and UEFA competitions reveal that teams averaging more than one additional fixture per week during peak months often show declines in possession retention and shot accuracy by the following weekend, with recovery timelines extending into subsequent matchdays.
Researchers compile fixture lists from the English Premier League, Bundesliga, La Liga, and Serie A to identify congestion windows, typically spanning October through December and March through May, then overlay performance indicators such as expected goals differentials and pass completion rates to quantify slumps. Studies from sports science departments at institutions across Europe demonstrate that squads participating in Champions League or Europa League group stages encounter these clusters most frequently, leading to rotation challenges that affect both starters and substitutes.
Defining Midweek Fixture Clusters and Their Seasonal Distribution
Fixture clusters occur when teams play on a Tuesday or Wednesday followed by a Saturday or Sunday, compressing recovery windows to less than 72 hours, and league calendars in the 2025-26 campaign illustrate how these pile up around European matchweeks. Observers note that the December festive period in England and the winter breaks in Germany and Italy create contrasting pressures, while June 2026 preparations for international tournaments add another layer as clubs manage player workloads ahead of national team commitments.
Performance databases maintained by organizations like the European Club Association record how clubs navigate these stretches, with metrics showing increased injury incidence rates during such periods compared to evenly spaced schedules. Analysts cross-reference these figures with travel distances and time zone shifts for teams competing across multiple countries, revealing additional variables that compound fatigue beyond simple match counts.
Methods for Monitoring Form Slumps Through Statistical Indicators
Tracking relies on standardized metrics including distance covered per minute, high-intensity sprints, and duel success percentages drawn from optical tracking systems deployed across major European stadiums. Data indicates that teams experiencing four or more midweek fixtures within a six-week block display statistically significant reductions in these areas during the immediate follow-up league games, with patterns holding across multiple seasons.
Software platforms aggregate results from matches played under congestion and compare them against baseline performances from non-congested periods, allowing pattern recognition that highlights vulnerable positions such as central midfield and full-back roles. Those who study workload management point to examples where squads that maintained squad depth through strategic January signings mitigated some of the measurable drops observed in thinner rosters.
League-Specific Patterns and Documented Case Examples
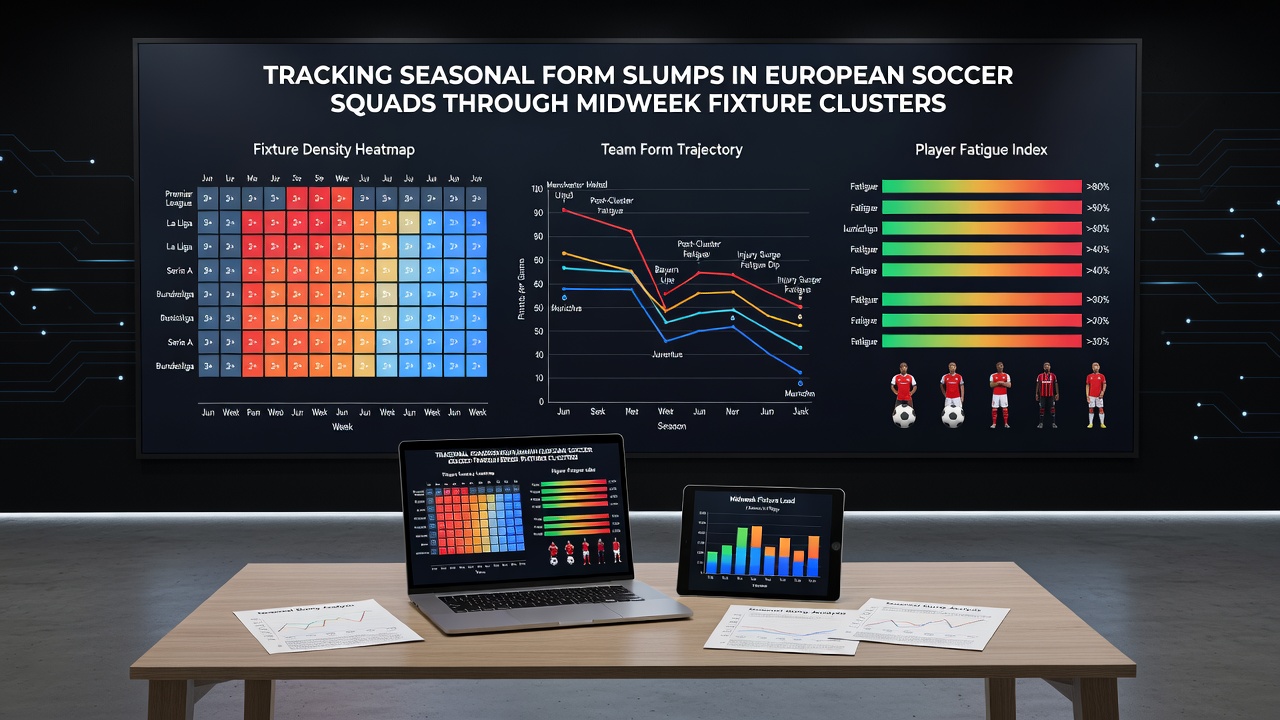
English clubs competing in both the Premier League and midweek European ties frequently record the steepest post-cluster dips according to aggregated league tables, whereas Bundesliga sides benefit from a winter break that interrupts the longest congestion sequences. La Liga and Serie A squads face different distributions due to varying cup commitments and national holiday calendars, producing distinct slump timelines that researchers map separately for each competition.
One documented sequence from the 2024-25 season involved a top-four Premier League side that played five midweek games across eight weeks and subsequently lost ground in the title race with consecutive weekend results showing reduced goal conversion efficiency. Similar patterns emerged in Serie A where clubs balancing Coppa Italia ties alongside league fixtures exhibited parallel declines in clean sheet percentages during the spring months.
Recovery Protocols and Their Measurable Effects on Subsequent Fixtures
Clubs implement individualized recovery plans incorporating cryotherapy, nutrition timing, and load monitoring devices to shorten the duration of observed slumps, and evidence from training ground reports shows that teams adhering to structured rest protocols regain baseline metrics faster than those relying on standard schedules. Figures released by international player unions highlight how collective bargaining agreements now include clauses addressing minimum rest periods between matches, influencing how clubs construct their seasonal calendars.
Coaches adjust training intensity in the 48 hours following midweek fixtures, substituting high-volume drills with lighter activation sessions, and data collected from GPS units worn during these periods confirms lower accumulated workloads correlate with steadier weekend outputs. Patterns observed across multiple leagues suggest that early identification of emerging slumps through these monitoring tools allows proactive rotation decisions before results compound the issue.
Conclusion
European soccer's fixture calendar produces predictable clusters that analysts monitor through layered performance data, revealing consistent associations between midweek demands and weekend form dips across seasons. Continued refinement of tracking methods and recovery strategies provides clubs with tools to address these recurring challenges, while broader scheduling discussions among governing bodies aim to balance competitive calendars with player welfare considerations in the years ahead.