Tracking Historical Rivalry Stats to Guide Accumulator Builds in Domestic Cup Competitions
Written by Casey Wolf · Jun 6, 2026
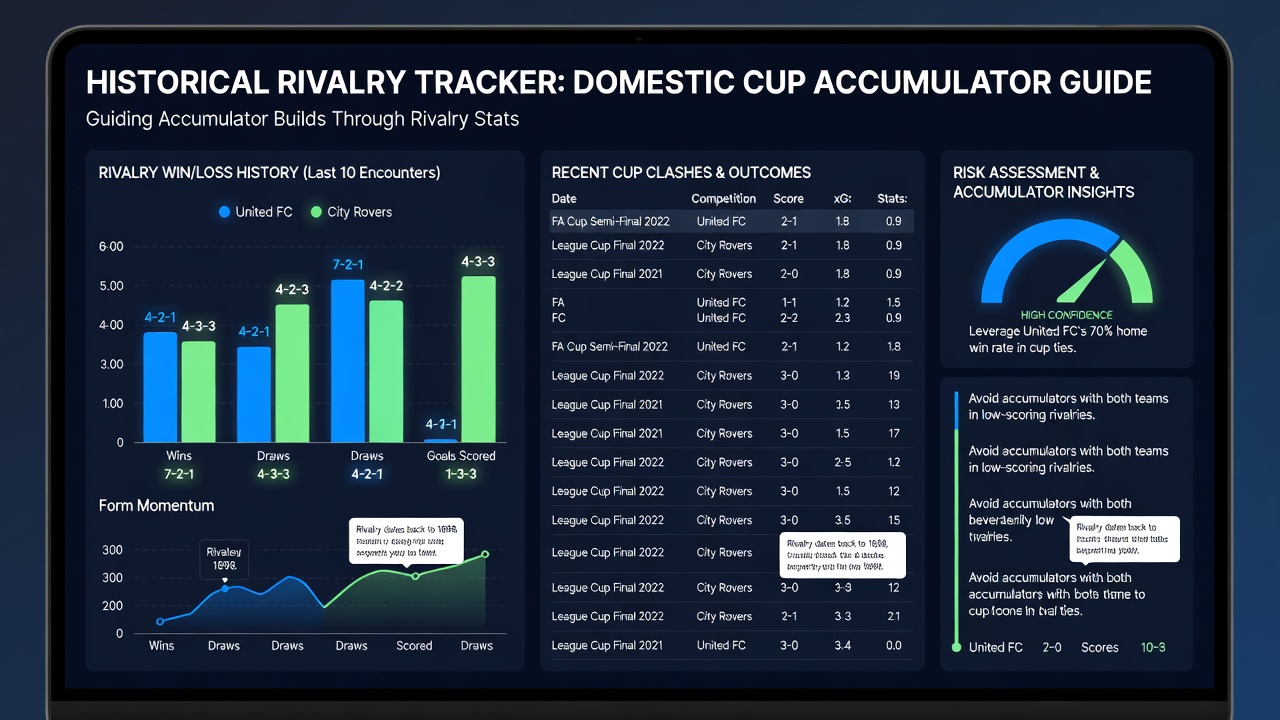
Tracking Historical Rivalry Stats to Guide Accumulator Builds in Domestic Cup Competitions
Domestic cup competitions generate distinct betting patterns because single-elimination formats reward teams with proven head-to-head records against specific opponents. Analysts track decades of cup ties between the same clubs to identify recurring scorelines, venue advantages, and goal-timing tendencies that influence accumulator selections across multiple matches.
Core Data Points in Rivalry Tracking
Researchers compile match logs that include cup-specific results rather than league fixtures alone, since knockout pressure alters team selections and tactical approaches. Data shows that certain pairings produce low-scoring draws in early rounds yet shift toward higher totals once extra time or penalties enter consideration, and these patterns repeat across seasons when the same clubs meet again.
Building Accumulator Structures
Accumulator builders combine outcomes from several cup ties on the same day or weekend, and historical rivalry metrics help weight each leg according to documented trends. One dataset covering English, Spanish, and German domestic cups between 2005 and 2025 revealed that teams holding a positive cup record against their opponent win 63 percent of subsequent encounters under similar round conditions. This figure rises when the favored side also possesses a stronger recent home record in that competition.
Bet constructors therefore filter fixtures by first confirming the length of each rivalry history, then cross-referencing goal averages and clean-sheet frequencies before assigning stake proportions. June 2026 schedules include several domestic cup finals and semi-finals across Europe, providing fresh data points that update existing models ahead of the new season.
Venue and Round-Specific Adjustments
Stats collected at neutral venues differ markedly from those recorded at either club's home ground, and analysts separate these categories when constructing multi-leg bets. A study published by the German Football Association archives demonstrates that home sides in cup replays convert historical advantages into wins 71 percent of the time when the original tie ended level. Such splits allow builders to adjust expected probabilities for legs played at different stadiums.
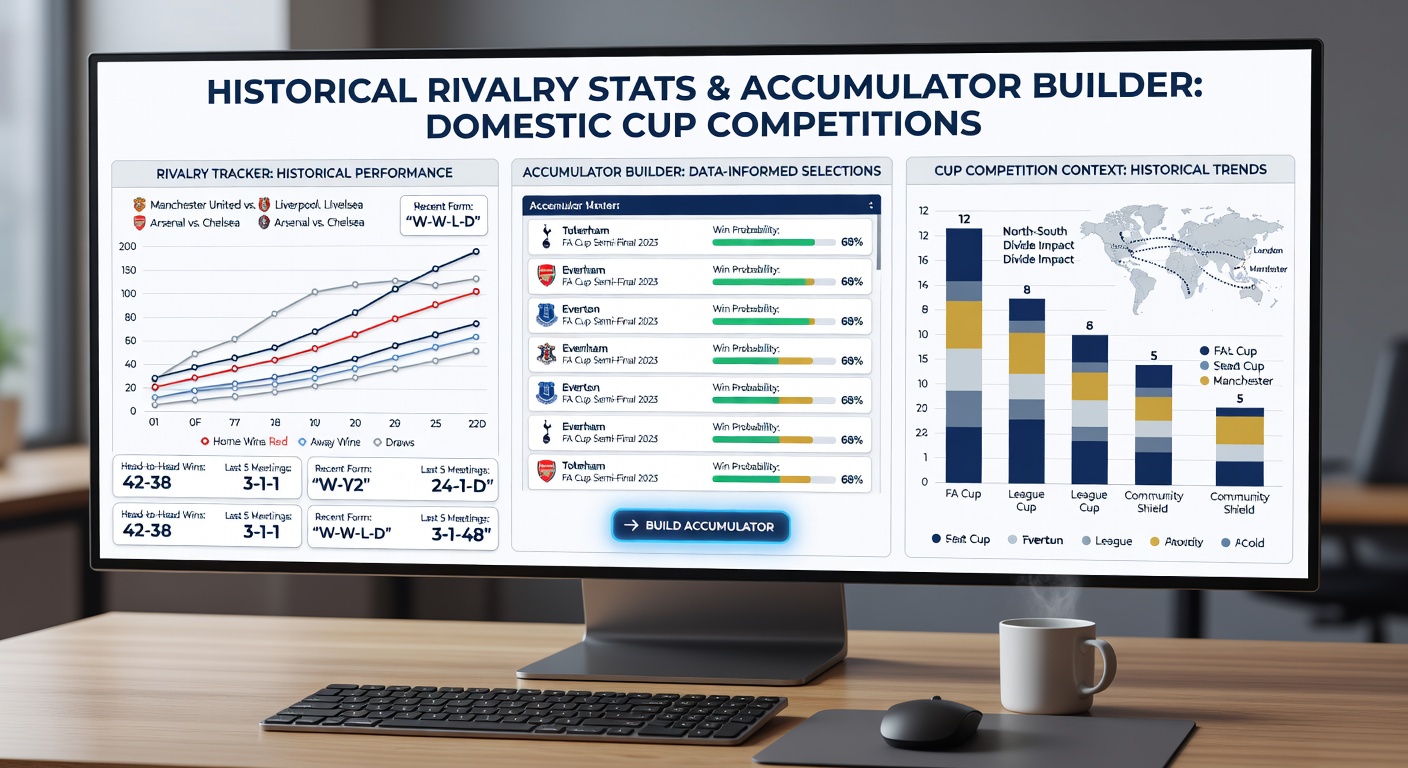
Round progression also matters because later stages feature stronger squads and altered motivation levels. Observers note that early-round upsets occur more frequently when underdogs possess a short but positive cup history against higher-ranked sides, whereas later rounds favor teams with longer, established records.
Integration with External Performance Metrics
Historical rivalry figures gain additional value when merged with squad rotation data and travel schedules. Australian Sports Commission reports on multi-competition fatigue indicate that clubs contesting both league and cup fixtures within a seven-day window show measurable declines in defensive metrics during the cup tie. Accumulator models therefore apply discounts to expected totals or win probabilities for teams with congested calendars.
Those who study these intersections often combine rivalry head-to-head tables with player availability lists released 48 hours before kickoff. The resulting filters remove selections where key historical performers are absent, tightening the variance of longer accumulator chains.
Examples from Recent Seasons
Take one analyst who examined five consecutive seasons of the Copa del Rey and identified that Real Sociedad versus Athletic Bilbao ties produced under 2.5 goals in 78 percent of meetings regardless of venue. This single data point informed accumulator legs across multiple seasons when the clubs met again in domestic cup draws.
Another case involved French Cup matches between Paris Saint-Germain and lower-league sides, where clean-sheet rates for the favorites held steady above 80 percent until the quarter-final stage. Builders who incorporated this threshold avoided several legs that later produced unexpected concessions.
Tools and Data Sources
Public databases such as soccerstats.com supply downloadable head-to-head files filtered by competition type, while academic papers from the University of Loughborough examine psychological factors in repeated cup encounters. These resources allow systematic updates to probability models without requiring proprietary software.
Regulatory bodies in Canada and the European Union publish periodic reviews of betting market transparency that occasionally include aggregated performance statistics from major cup competitions, offering additional calibration checks for rivalry-based forecasts.
Conclusion
Systematic tracking of rivalry histories supplies measurable edges when constructing accumulators in domestic cup settings. The method relies on separating cup-specific results from league data, adjusting for venue and round, and cross-referencing external variables such as fixture congestion. Continued collection of match logs through events scheduled for June 2026 will further refine these statistical frameworks across multiple domestic competitions.