Schedule Density's Hidden Influence on Professional Basketball Betting Lines
Written by Kai Griffin · Jul 2, 2026
Schedule Density's Hidden Influence on Professional Basketball Betting Lines
Schedule density refers to the clustering of games within short time frames, including back-to-backs, three-in-fives, and extended road trips that compress recovery windows for NBA teams. Data from the league's official scheduling records shows that teams average between 18 and 22 back-to-back sets per season, with density peaking during January and March windows when travel logistics intensify across time zones.
Measuring Schedule Density Through Concrete Metrics
League statisticians track density using variables such as games per seven-day period, cumulative air miles between venues, and rest days since the previous contest. Figures compiled by the NBA reveal that Western Conference clubs log an average of 42,000 air miles annually compared with 31,000 for Eastern Conference counterparts, creating measurable differences in fatigue accumulation that influence both team totals and spread outcomes.
Researchers at the University of Waterloo examined five seasons of play-by-play data and documented a 3.8-point drop in offensive efficiency for squads playing their second game in two nights. The same analysis found that three-in-five stretches correlate with a 7 percent increase in turnovers per 100 possessions, a statistic that directly feeds into over-under calculations released by sportsbooks.
Line Movement Patterns Tied to Density
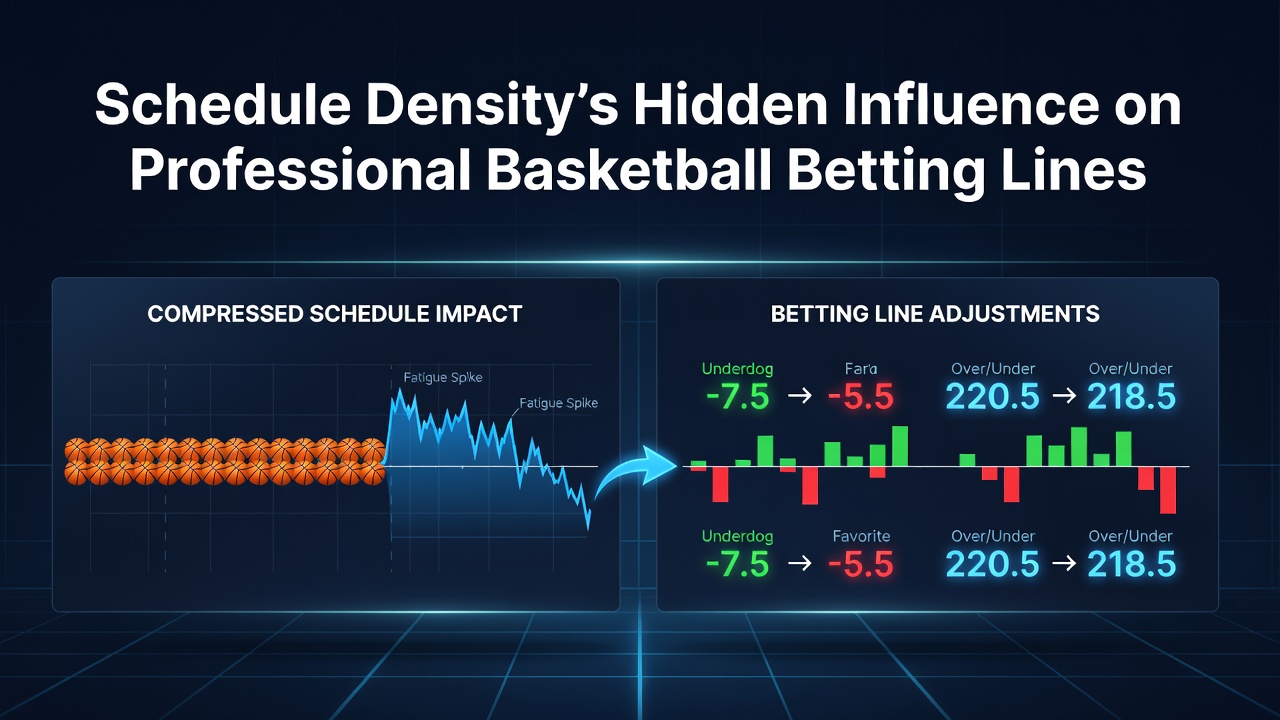
Betting markets incorporate rest differentials into opening lines, yet schedule density extends beyond simple rest counts to include cumulative load across multiple weeks. Observers note that totals lines drift downward by an average of 2.5 points when both teams enter a contest after a three-in-five sequence, according to aggregated closing-line data from multiple sportsbooks.
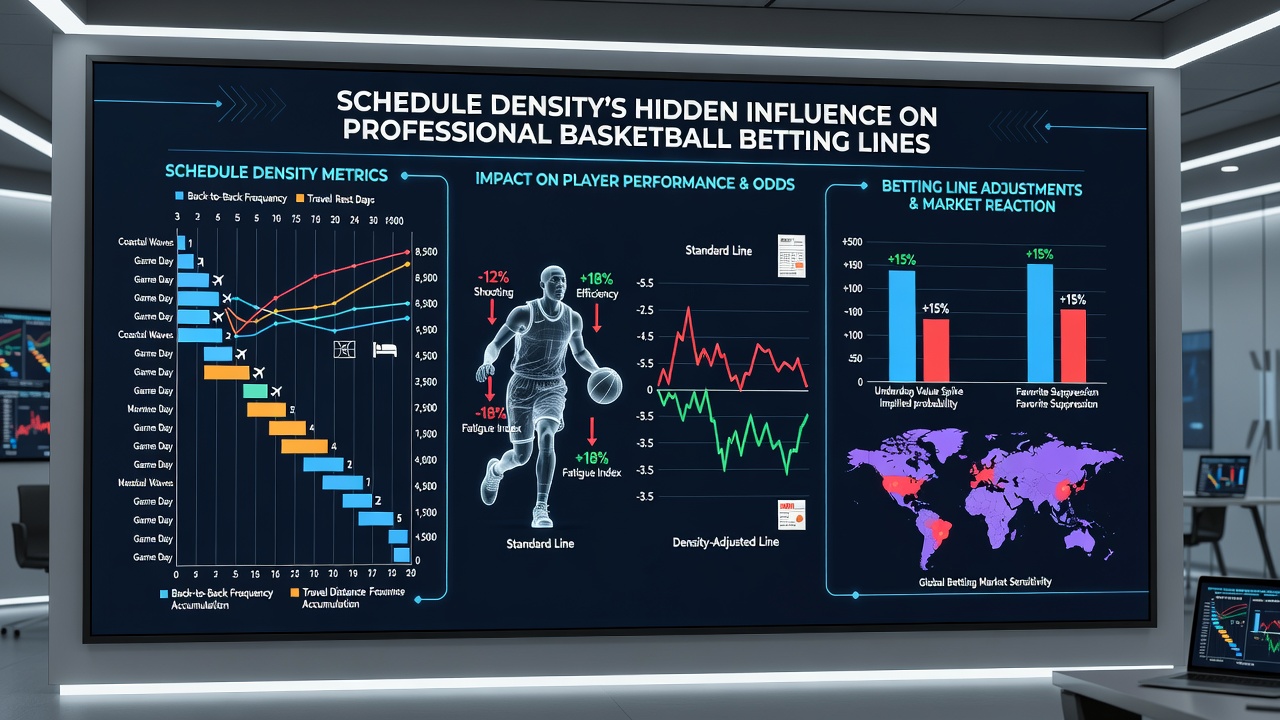
Spread movement follows a different pattern. Teams with higher schedule density in the prior 14 days cover the spread at a 47.2 percent rate, per historical records maintained by the league's statistical partners. This underperformance persists even after oddsmakers adjust for travel, suggesting that density factors remain partially unpriced in early line releases.
Player Props and Density Effects
Individual prop markets show sharper reactions once density reaches critical thresholds. Minutes restrictions appear more frequently after back-to-back sets, trimming expected points and rebounds for star players by 12 to 15 percent. Data released through the NBA's injury tracking system indicates that load-management decisions increase by 22 percent during periods when teams face four games in six days.
Those studying prop bet correlations have identified consistent suppression in assist numbers for point guards on the second night of back-to-backs, a trend that holds across both conference and non-conference matchups. July 2026 schedule releases will allow analysts to map these density clusters months in advance, giving markets additional time to incorporate cumulative load data into preseason prop projections.
Conference and Travel Asymmetries
Geographic imbalances amplify density impacts. Pacific Division teams encounter more cross-country trips during Eastern swings, resulting in higher instances of same-day travel after night games. Records maintained by the league show these clubs post a 4.1-point deficit in net rating on the second night of such trips compared with home stands following equivalent rest.
European regulatory bodies such as the European Gaming and Betting Association have published reports noting similar scheduling variables in other professional leagues, where travel density correlates with variance in scoring margins that betting operators must model. American Gaming Association data similarly highlights how North American leagues adjust market thresholds when multiple high-density periods overlap within a single month.
Seasonal Windows and Density Spikes
Density does not distribute evenly across the calendar. The post-All-Star period typically features compressed schedules designed to accommodate playoff preparation, and historical box-score aggregates show a corresponding rise in game totals variance. Teams exiting the break with four games in eight days have produced totals that land under the closing line 53 percent of the time over the past decade.
Preseason schedule construction in July 2026 will again determine which clubs absorb the heaviest early-season loads. Analysts tracking these releases can isolate specific back-to-back clusters that historically depress both team efficiency ratings and overs percentages, providing a framework for line evaluation once regular-season betting opens.
Conclusion
Schedule density operates as a persistent variable that influences efficiency, scoring, and rest patterns across the NBA calendar. Quantitative records demonstrate measurable effects on totals, spreads, and prop markets even after conventional rest adjustments appear in betting lines. As the 2026-27 schedule takes shape, density mapping offers one additional layer of data for evaluating how performance metrics translate into market outcomes.