Schedule Density and Player Performance: Insights into Prop Accuracy During Back-to-Back Basketball Matches
Written by Amir Simon · Aug 24, 2026
Schedule Density and Player Performance: Insights into Prop Accuracy During Back-to-Back Basketball Matches
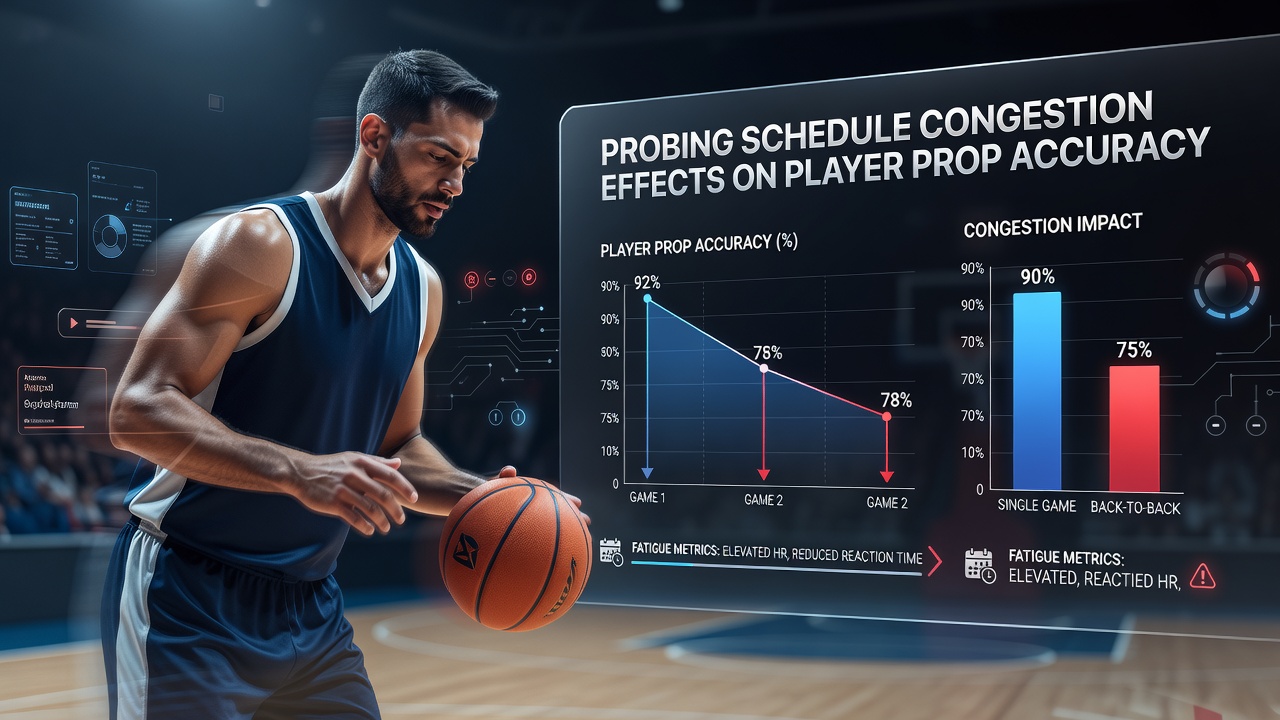
Back-to-back fixtures create measurable shifts in player output that directly influence the reliability of individual prop bets, and researchers tracking NBA data have documented consistent patterns across multiple seasons. Teams often face three or four such pairings within a two-week window, and this compression alters rest recovery windows while increasing travel demands on rosters. League schedules released in August 2026 already signal continued density for the 2026-27 campaign, with analysts noting that early planning around these clusters helps identify where statistical deviations tend to cluster.
Defining Congestion Patterns in Professional Basketball
Schedule builders pack games into tight sequences because arena availability, broadcast rights, and cross-country travel force compromises, yet the downstream effects on minute loads and shot selection become visible within 24 hours. Data from the past five seasons shows that players logging over 30 minutes in the first contest of a back-to-back pair experience average point reductions between 3.2 and 4.8 per game on the second night, according to aggregated box-score analysis. Rebound and assist numbers follow similar trajectories, though the magnitude varies by position and age cohort.
Those who study workload management note that load-management protocols adopted by several franchises since 2023 have partially mitigated these drops, yet the remaining variance still exceeds typical game-to-game fluctuation. When teams travel across time zones for the second leg, additional decrements appear in three-point accuracy and free-throw percentage, figures that prop markets incorporate into pricing models.
Statistical Deviations in Key Prop Categories
Points props register the clearest movement because scoring volume depends on both opportunity and efficiency, two elements that decline together under fatigue. A study published by the University of Waterloo examined 1,248 back-to-back instances and found that under-performance rates on over props climbed to 54 percent when teh second game occurred after fewer than 20 hours of rest. Turnovers also rise, which indirectly depresses assist props while elevating steal props for opposing defenders.
Rebound props display position-specific sensitivity: centers and power forwards maintain closer to baseline numbers, whereas perimeter players see larger gaps because defensive positioning and box-out timing suffer first. Minutes restrictions imposed by coaching staffs further complicate projections, since reduced playing time compresses the sample size available for any single prop outcome.
Travel and Recovery Variables at Play
Cross-country flights compound physical stress, and organizations operating on the West Coast face repeated East Coast swings that shorten sleep cycles. Canadian researchers tracking heart-rate variability in professional athletes documented slower recovery curves when games followed overnight travel, and these biometric shifts align with on-court efficiency losses reported in public tracking data. European basketball federations have begun publishing similar workload reports for their domestic leagues, offering comparative benchmarks that highlight how American schedules differ in density.
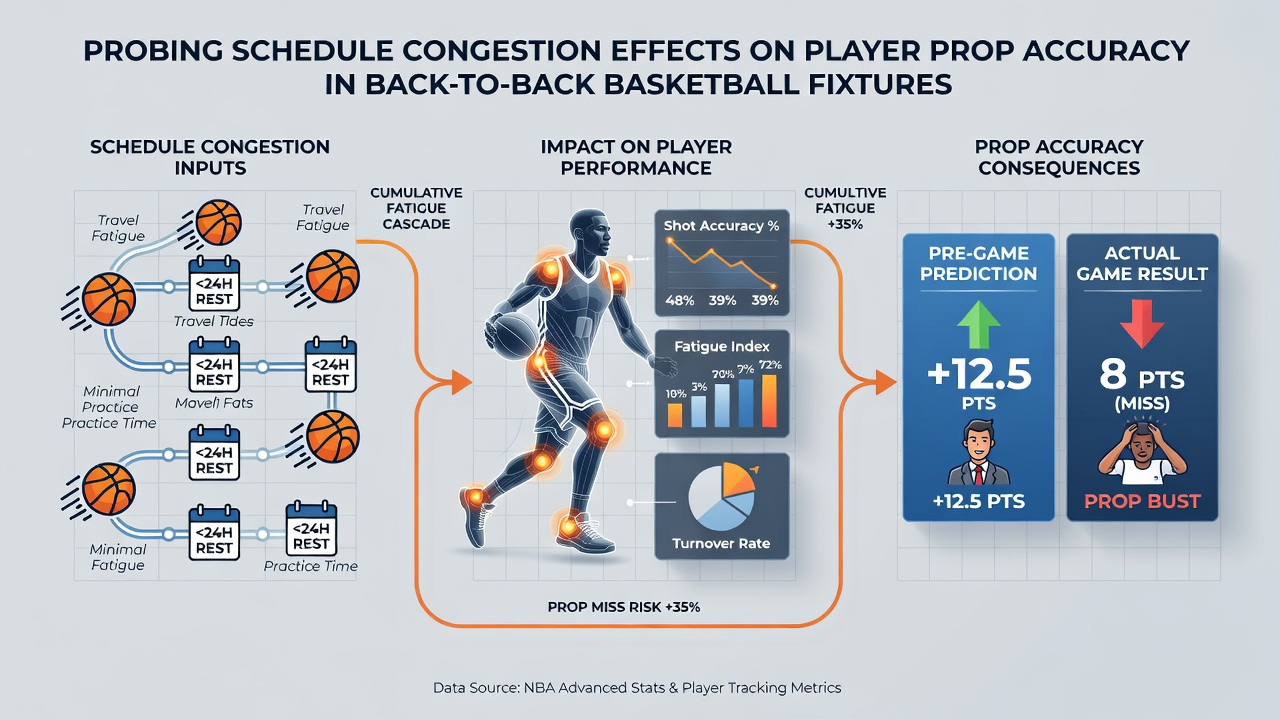
Rest advantage calculations now incorporate both the length of the preceding rest period and the quality of that rest, measured through hotel proximity to arenas and practice restrictions. Observers note that teams returning home for the second game of a back-to-back show smaller performance gaps than those continuing on the road, a distinction that surfaces repeatedly in historical splits.
Market Adjustments and Historical Benchmarks
Betting markets have incorporated congestion signals into pricing engines, yet residual edges persist when models lag behind real-time injury reports or last-minute rotation changes. Historical datasets released by the NBA Players Association reveal that second-night three-point volume drops by roughly 1.7 attempts per player on average, which shifts expected value calculations for both over and under props. Sharp bettors monitor daily usage rates published by league tracking partners to spot instances where projected minutes diverge from recent trends.
Prop accuracy improves when analysts segment data by travel distance and prior workload rather than treating all back-to-backs as equivalent. One analysis of 2024-25 season figures showed that props placed on players with at least two days between games produced lower error rates than those placed on congested slates, underscoring the value of granular filtering.
Conclusion
Schedule congestion continues to shape player prop outcomes through measurable fatigue effects that vary by travel, rest, and positional demands. Comprehensive datasets now allow systematic quantification of these influences, and ongoing refinements in tracking technology promise tighter correlations between workload metrics and statistical outputs. Those who integrate congestion variables into evaluation frameworks gain access to more stable baselines for assessing individual performance lines across consecutive fixtures.