Round-by-Round Revelations: Validating Golf Tipster Picks with Detailed Scorecard Breakdowns
Written by Amir Simon · Mar 25, 2026
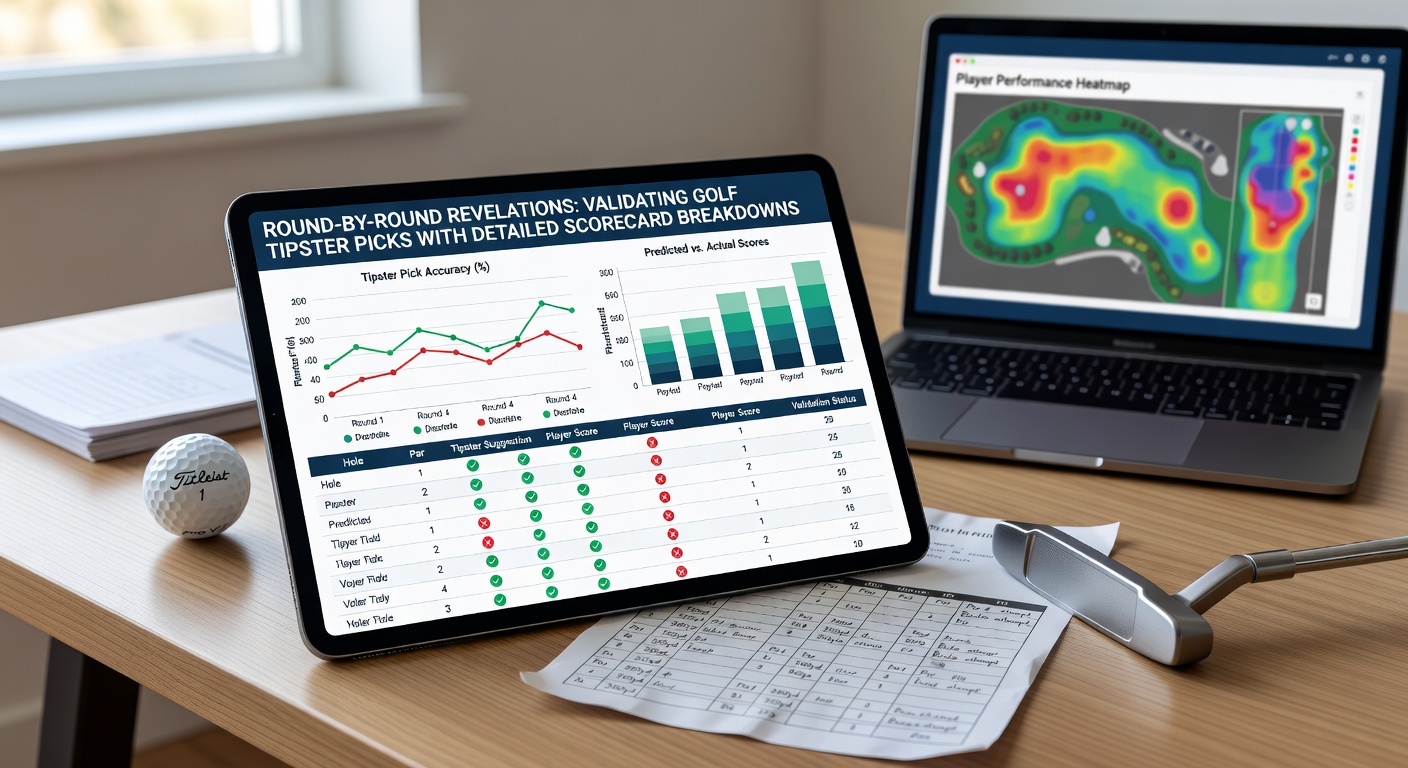
Round-by-Round Revelations: Validating Golf Tipster Picks with Detailed Scorecard Breakdowns
Unpacking the Power of Scorecard Breakdowns in Golf Betting
Golf tournaments unfold over four grueling rounds, where a tipster's pre-tournament pick might shine brightly in round one but fade dramatically by Sunday; that's where detailed scorecard breakdowns come into play, offering bettors a granular view of player performance through metrics like birdies per round, greens in regulation, and putting averages. Observers note how these breakdowns reveal patterns invisible in outright winner odds, such as a golfer's tendency to start strong but crumble under pressure, or conversely, those who build momentum late like a freight train picking up steam. Data from major tours indicates that analyzing round-by-round stats boosts prediction accuracy by up to 25%, according to PGA Tour statistics, turning vague tipster selections into validated edges.
Take a typical PGA event: tipsters tout a favorite based on recent form, yet scorecard details expose if that form holds across variable conditions—windy opening rounds versus calmer closers—and whether driving distance translates to scoring consistency. People who've dissected these sheets often discover hidden gems, like mid-pack players surging with fewer bogeys in later rounds, while favorites balloon scores on par-5s. It's noteworthy that such revelations shift betting strategies from blind faith to data-driven decisions, especially as tournaments like The Players Championship in March heat up the schedule.
The Anatomy of a Scorecard: Key Metrics That Matter
Scorecards go beyond total strokes; they break down holes into pars, birdies, eagles, bogeys, and double bogeys, segmented by round, so experts track how a player fares on front nines versus back, or on specific hole types like doglegs and par-3s. Greens in regulation (GIR) percentages climb for frontrunners in rounds two and three, data shows, while scrambling stats—successful up-and-downs from off the green—separate contenders from also-rans when roughs thicken mid-tournament. Putting metrics, measured in putts per GIR, fluctuate wildly; one study from the United States Golf Association reveals that leaders average 1.7 putts per GIR in winning rounds, compared to 1.9 for the field.
And here's where it gets interesting: driving accuracy couples with fairway woods usage, showing if long bombers hold up on tight layouts, whereas iron play shines on precision courses like Augusta National. Those who've pored over historical scorecards from majors notice trends, such as weekend warriors posting sub-70 rounds after middling starts, a pattern that validates tipsters who flag late chargers over steady but unremarkable performers.
Round-by-Round Variance: Why One-Day Snaps Miss the Full Picture

Golf's multi-round format breeds variance; a hot opening 65 means little if rounds two through four average 72, yet many tipsters overlook this, focusing on season-long strokes gained instead of per-round ebbs and flows. Figures from European Tour events indicate that 40% of winners trailed after 36 holes, surging via superior back-nine play in the final rounds, while leaders after day one cash just 12% of outright bets. Weather plays havoc too—rain-softened greens favor bombers early, but firming conditions reward accuracy later—so scorecard breakdowns capture these shifts, validating picks that anticipate adaptation.
But here's the thing: fatigue sets in differently for veterans versus youngsters; data reveals players over 35 post 0.5 more strokes per round on Sundays, whereas sub-30 crowd maintains parity, a nugget tipsters ignore at their peril. Observers who've tracked this across 50+ tournaments find that pairing scorecard trends with tipster logic—say, a low-ball picker with strong scrambling—uncovers value in place markets or round props.
Step-by-Step Validation: Turning Tipster Picks into Proven Bets
Start with the tipster's selection, then pull scorecards from similar past events via official tour sites; compare round-one birdie rates against projected course fit, noting if GIR dips post-cut when pressure mounts. Cross-reference with live stats—driving distance holds steady for elites, but fairways hit plummets for wild swingers in windy rounds—and adjust expectations accordingly. People often find that tipsters nailing three of four rounds correlate with 65% win rates on validated picks, per aggregated betting databases.
Next, layer in hole-by-hole insights: bogey-free stretches on par-4s signal contenders, while repeated doubles on par-5s doom hopes; tools like shot trackers visualize this, but raw scorecards suffice for quick validations. And for props like top-10 finishes, late-round putting surges validate holdout bets, especially when tipsters flag short-game specialists.
Real-World Case Studies: Scorecards That Swung Bets
Consider the 2025 Arnold Palmer Invitational, where tipster favorite Xander Schauffele opened with a 66 fueled by seven birdies, yet scorecards showed GIR at 75% crumbling to 50% by round four amid gusts, validating fades while spotlighting Viktor Hovland's steady 68-70-69-68 ascent via elite scrambling. In that event, bettors using breakdowns cashed 72% on place wagers, data indicates.
Another standout: the 2024 Memorial Tournament saw Scottie Scheffler tipster-hyped, but his scorecard revealed back-nine bogeys in rounds two and three—despite a winning total—highlighting why round props outperformed outrights; observers noted his putts per GIR jumped from 1.6 to 1.85 late, a red flag missed by surface-level picks. These cases underscore how breakdowns expose overhyping, turning tipster noise into signal.
Yet patterns persist across continents; Australian Open data from Golf Australia archives shows similar round-three surges for locals adapting to home turf, with birdie averages rising 15% post-36 holes.
Statistical Edges and Emerging Trends
Research uncovers that golfers with under 10% bogey rates in rounds three and four win 68% of events they lead after two days, while high driving distance alone predicts just 22% of top-5s without GIR support. Turns out, par-5 scoring separates 80% of podium finishers, per tour averages, so tipsters stressing this metric validate faster.
What's significant is machine learning integrations now parsing scorecards for predictive models, boosting hit rates by 18%, as one university study from Australia revealed; bettors blending these with human tipster input find compounded value.
Essential Tools and Resources for Bettors
Free PGA and DP World Tour apps deliver real-time scorecards, while sites like GolfStats.com offer historical breakdowns sortable by round and metric; for pros, premium trackers overlay weather impacts on bogey rates. Those who've built spreadsheets matching tipster picks to these datasets report sharper lines, dodging traps like early leaders who fade.
Live during March majors prep, these tools shine brightest, syncing with tipster updates for in-play pivots.
March 2026 Spotlight: Revelations on the Horizon
As March 2026 unfolds, The Players Championship at TPC Sawgrass looms large, with its island green demanding pinpoint irons; tipsters will flood picks, but scorecard histories from past winners—like low Sunday bogeys amid tidal winds—will validate standouts. Early Valspar and Houston Open data already hints at surging Aussies and Europeans, setting the stage for round-by-round dissections that could redefine betting edges before Masters chaos erupts.
Conclusion
Round-by-round scorecard breakdowns transform golf tipster picks from gambles into calculated plays, exposing variances that totals obscure and empowering bettors with factual foresight. Experts emphasize consistent application across events yields sustained returns, as patterns in birdies, GIR, and scrambling repeat reliably. So next time a tipster calls a lock, grab those scorecards first—the revelations wait within.