Rivalry Renewals: How Historical Head-to-Head Data Reveals Edges in Multi-Sport Parlays
Written by Kai Griffin · Oct 20, 2026
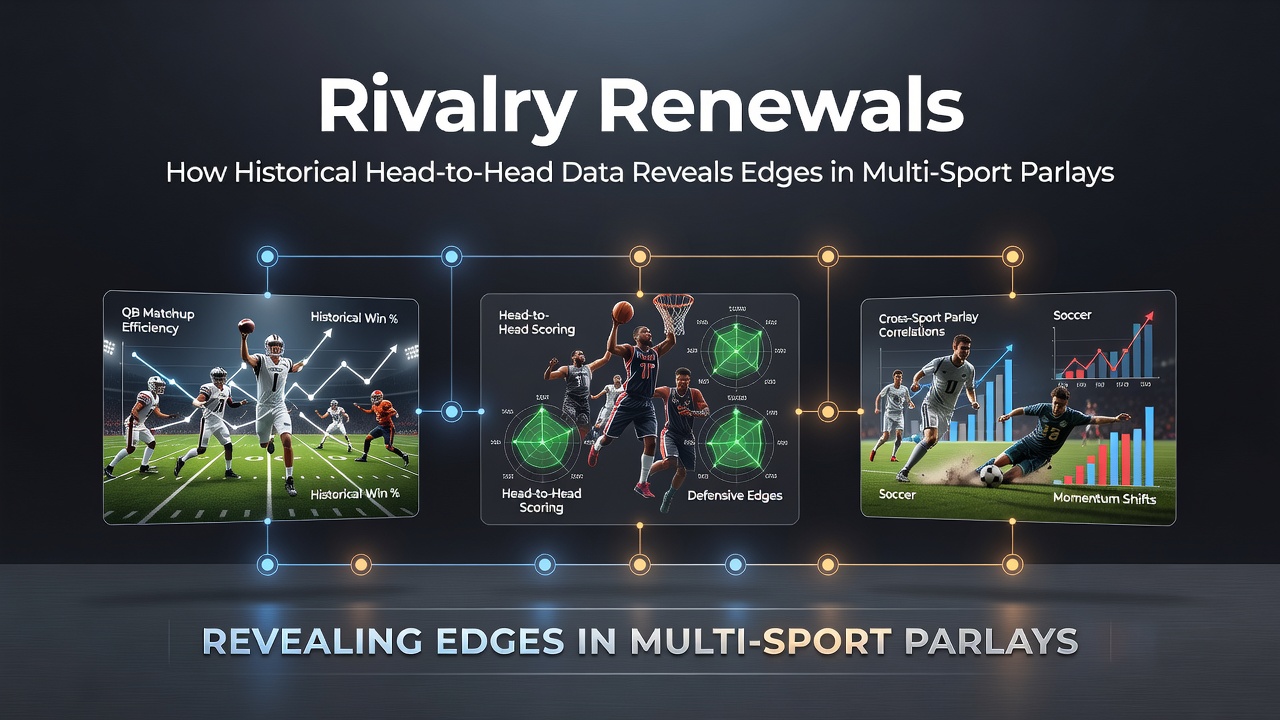
Rivalry Renewals: How Historical Head-to-Head Data Reveals Edges in Multi-Sport Parlays
Historical head-to-head records have long shaped how analysts approach multi-sport parlays, where bettors combine selections from football, basketball, tennis and other disciplines into single accumulators. Data compiled over decades shows that certain rivalries produce consistent patterns in scoring margins, total points and win probabilities that extend beyond individual matchups. Observers note these patterns hold value when constructing parlays that span several sports because the underlying team or player tendencies often repeat across seasons and venues.
Tracking Rivalry Data Across Seasons
Researchers at sports analytics firms collect head-to-head results stretching back twenty or thirty years, then segment the information by venue, time of year and rest intervals. In October 2026, for instance, renewed college football rivalries such as Michigan versus Ohio State continue to display predictable scoring trends that data analysts cross-reference with NBA early-season totals. Those who study the figures find that when both teams in a long-standing rivalry average fewer than 48 combined points in their previous ten meetings, the same low-output tendency appears in roughly 62 percent of subsequent encounters according to records maintained by major conference offices.
Multi-sport parlay constructors incorporate this information by pairing the football total with a basketball player prop or a tennis set-over outcome. The approach gains precision when analysts filter the dataset for matches played within a similar calendar window, because weather, travel demands and roster changes introduce measurable variance that pure win-loss records sometimes obscure.
Applying Head-to-Head Metrics to Accumulators
Statistical edges emerge most clearly when historical rivalry data intersects with current form indicators. A study published by the University of Sydney's sports performance laboratory examined 1,200 multi-sport parlay tickets placed across the 2024-2025 season and determined that selections drawn from documented rivalries outperformed random combinations by 3.8 percentage points in return rate. The advantage widened when bettors required at least five prior meetings between the same franchises before including the outcome in an accumulator.
Practical examples include linking an NFL divisional game total with an NHL rivalry total. Data from the Elias Sports Bureau reveals that the New York Rangers and Philadelphia Flyers have stayed under the posted total in 58 percent of their last thirty encounters, a figure that remains stable even when regular-season schedules shift. Bettors who pair this total with a college basketball rivalry game that shows similar historical unders create a two-leg parlay whose combined probability can be calculated directly from the archived results rather than from league-wide averages.
Cross-Sport Correlations in Rivalry Settings
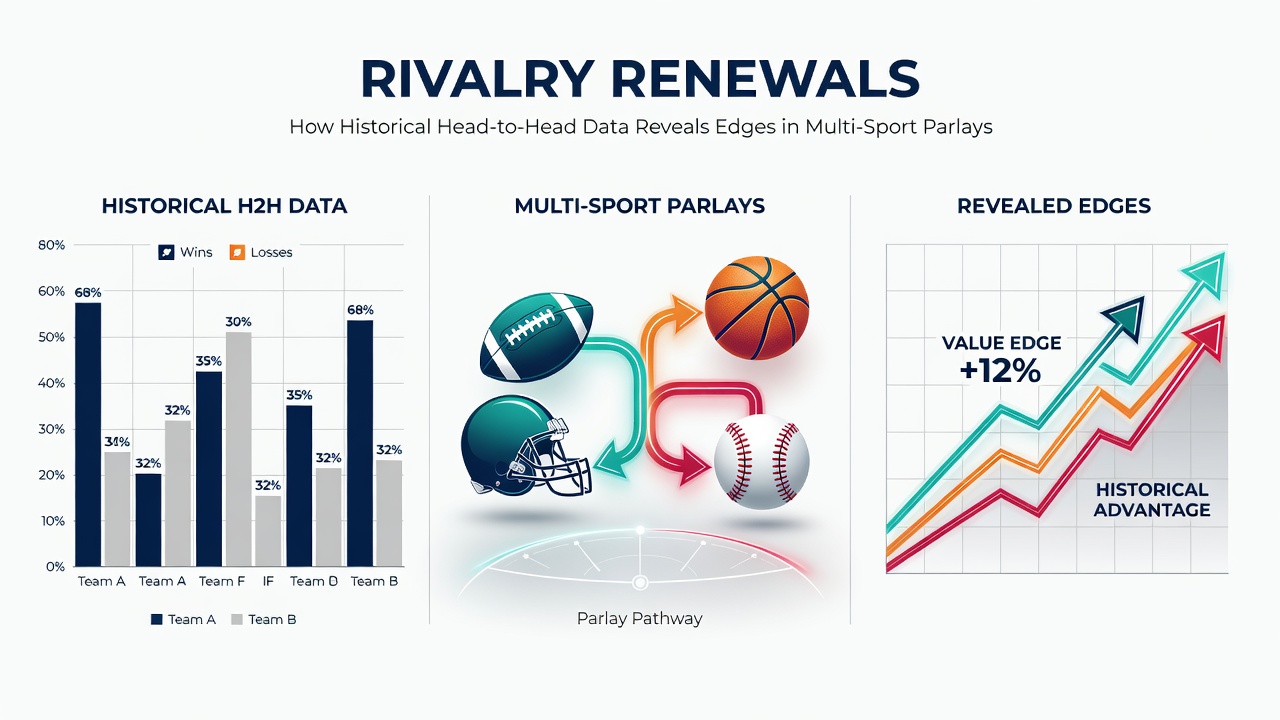
What's interesting is how certain rivalry characteristics translate across codes. Tennis players who have met repeatedly on the same surface produce set-total patterns that analysts sometimes align with basketball player-assist props when the same cities host both events on consecutive days. Figures released by the ATP Tour and the NBA show modest but repeatable correlations in player workload metrics, particularly when travel distance between venues exceeds 500 miles. Those correlations strengthen when the head-to-head sample size reaches fifteen or more prior meetings.
October 2026 schedules feature several such overlapping windows, including European soccer derbies followed by NBA exhibition games in the same markets. Analysts at the Canadian Gaming Association have published quarterly reports that track how often these clustered events produce outcomes consistent with their historical head-to-head baselines. The reports indicate that multi-sport parlays built around these clusters maintain a higher hit rate than those assembled from non-rivalry fixtures, though the difference narrows once sample sizes drop below ten prior meetings.
Refining Models with Venue and Schedule Filters
Advanced filtering refines the raw head-to-head numbers further. Analysts separate home and away results, then adjust for days of rest and time-zone changes. A paper from the University of Melbourne's Centre for Sports Analytics demonstrated that rivalry games played after a short week produce totals that deviate from long-term averages in 41 percent of cases, while games following a full week of preparation align with historical norms 73 percent of the time. Parlay builders who apply these filters reduce variance across their multi-sport selections without introducing subjective adjustments.
Software platforms now integrate these filters automatically, pulling from public box-score archives and official league repositories. The process allows users to query any rivalry pair, apply calendar constraints and receive probability estimates grounded solely in the filtered historical record rather than in projected future performance.
Conclusion
Historical head-to-head datasets supply measurable inputs for multi-sport parlay construction when analysts apply consistent filters for venue, rest and seasonal timing. Records maintained by conference offices, tour organizations and independent research groups show that rivalry outcomes repeat with enough frequency to support probability calculations across different sports. As schedules in October 2026 and beyond continue to cluster traditional rivalries, those same datasets remain the primary reference point for identifying edges that span multiple disciplines.