Recovery Patterns in Consecutive League Matches Across Professional Sports
Written by Kai Griffin · Sep 8, 2026
Recovery Patterns in Consecutive League Matches Across Professional Sports
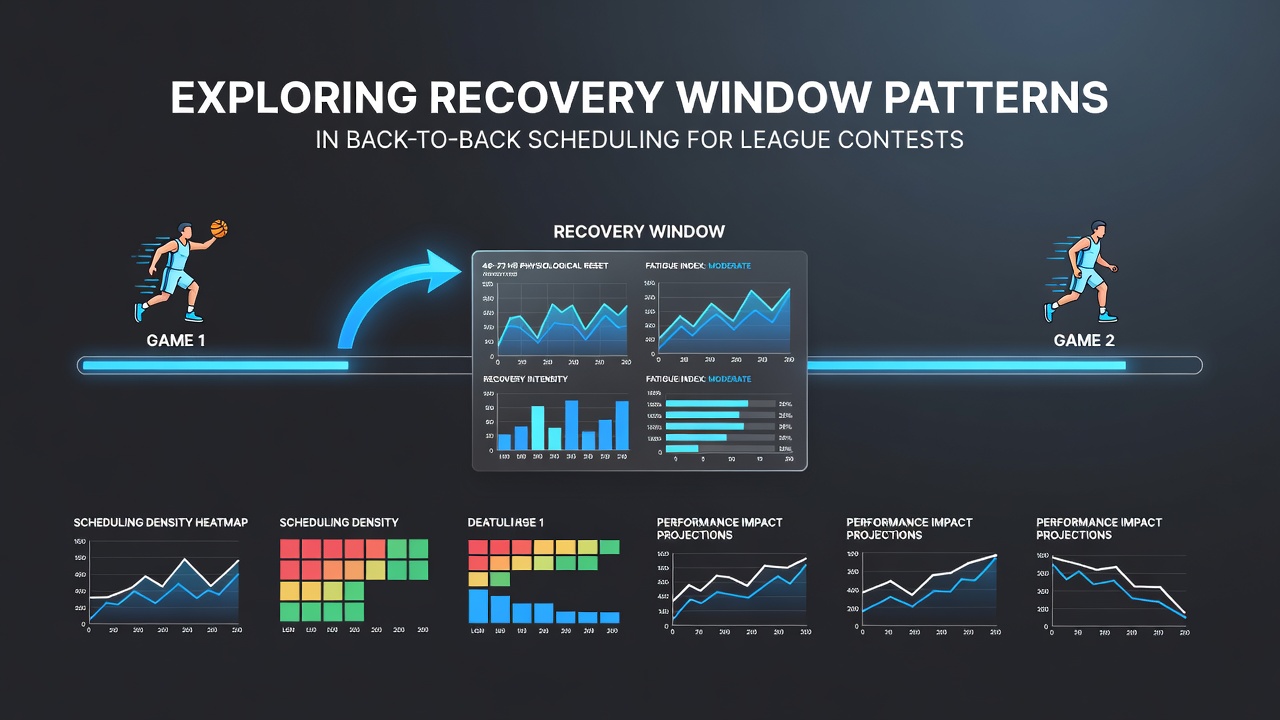
Back-to-back scheduling creates distinct recovery challenges in professional leagues, where teams often face matches with limited rest intervals between contests. Data from major competitions shows that these patterns influence player output in measurable ways, particularly in basketball and hockey where dense calendars persist throughout the season. Researchers tracking performance metrics have noted consistent variations tied to the length of recovery windows, with shorter intervals correlating to shifts in scoring efficiency and defensive metrics.
Defining Recovery Windows in League Contexts
Recovery windows refer to the time between the conclusion of one contest and the start of the next, encompassing travel, sleep cycles, and physiological restoration. In leagues such as the NBA and NHL, these intervals range from under 24 hours in back-to-back scenarios to several days during standard rotations. Studies compiled by sports science groups indicate that intervals below 48 hours frequently align with reduced shooting percentages in basketball, while hockey data reveals elevated penalty minutes when teams play on consecutive nights.
League officials adjust schedules annually to balance competitive demands with athlete welfare, yet back-to-back fixtures remain common due to broadcast requirements and venue availability. Observers note that September 2026 schedules for several North American leagues already list multiple clusters of consecutive games early in the campaign, prompting renewed analysis of historical patterns.
Observed Trends in Performance Data
Statistical reviews across multiple seasons demonstrate that teams in back-to-back situations exhibit measurable declines in key indicators. For instance, NBA records show average point totals drop by approximately 4 to 6 points per game when rest falls below 24 hours, according to aggregated league play-by-play information. In the NHL, goal-scoring rates decrease during the second game of such pairs, with power-play efficiency showing similar compression.
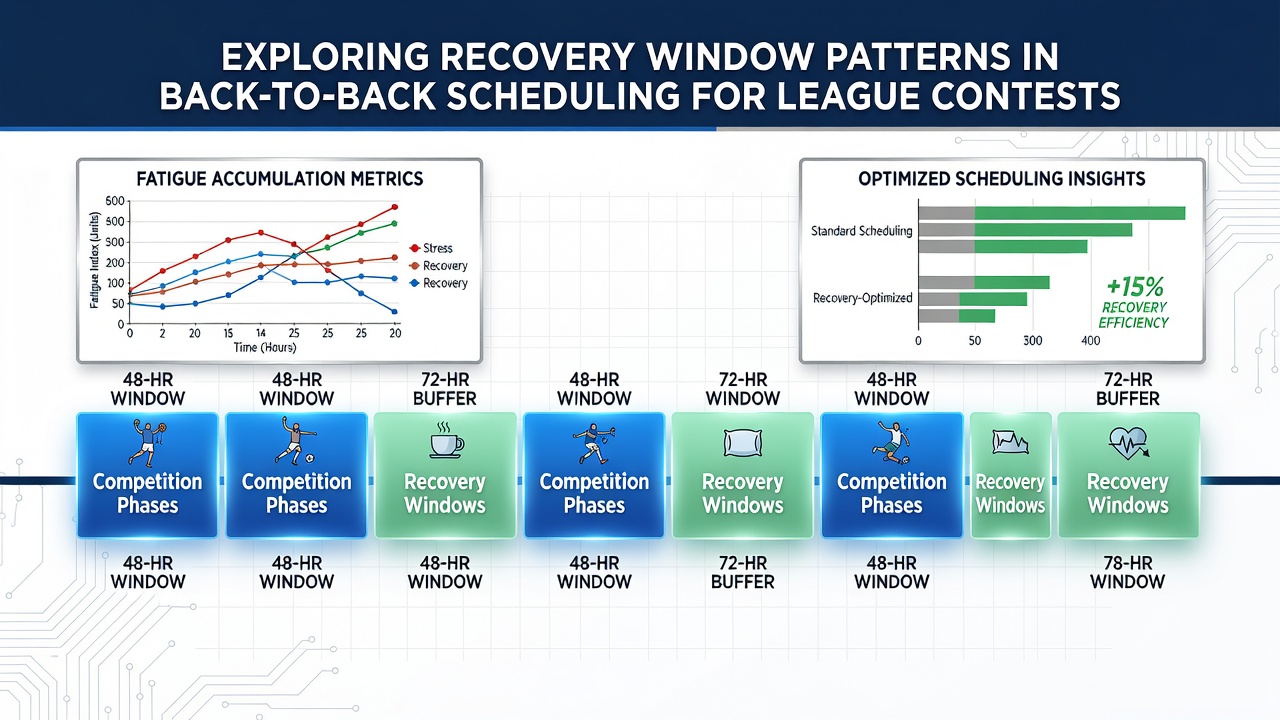
European soccer competitions present a contrasting picture because back-to-back domestic and continental fixtures occur less frequently than in North American leagues. Yet when they arise, fatigue markers tracked through GPS systems indicate elevated muscle-load accumulation, particularly among midfielders. Those who've examined these datasets find that recovery windows extending beyond 72 hours tend to restore baseline performance levels more reliably across sports.
League-Specific Scheduling Influences
Different leagues manage consecutive games through distinct rules and travel protocols. The NBA incorporates designated rest days for star players in certain markets, while the NHL relies on division alignments that reduce cross-country travel during dense periods. Australian football leagues apply similar principles but adjust for longer flight times between states, producing unique recovery profiles documented in national sports institute reports.
One study released in early 2026 examined five seasons of NHL data and found that teams traveling across time zones for back-to-back contests recorded higher rates of blocked shots in the second game, suggesting tactical adaptations to offset physical strain. Such findings align with observations from Canadian university researchers who analyzed workload distributions using wearable technology.
Physiological and Tactical Adjustments
Athletes and coaching staffs implement targeted interventions during short recovery periods, including compression therapy, nutritional timing, and modified practice loads. Data collected by the Australian Institute of Sport reveals that players who maintain consistent sleep schedules during these windows experience smaller drops in reaction time compared with those facing disrupted rest. League medical staffs monitor heart-rate variability as an early indicator of incomplete recovery, allowing for in-game substitutions that preserve overall squad output.
Tactical shifts also emerge in response to scheduling density. Teams facing consecutive contests often emphasize defensive schemes that require less high-intensity running, a pattern documented in video analysis from multiple European basketball federations. These adjustments do not eliminate performance variance but redistribute effort across available personnel.
Broader Implications for League Operations
League administrators continue to refine scheduling algorithms that incorporate recovery metrics alongside commercial considerations. Reports from the International Olympic Committee’s medical commission highlight how data-driven approaches to fixture lists have reduced injury incidence in several Olympic sports that adopted similar consecutive-match calendars. In September 2026, several professional organizations are scheduled to review updated models that weigh travel distance and rest intervals more explicitly.
Coaches and support personnel rely on these evolving datasets to inform daily decisions, from rotation planning to load management protocols. The accumulation of evidence across seasons provides clearer benchmarks for what constitutes adequate recovery under varying competitive conditions.
Conclusion
Recovery window patterns in back-to-back league scheduling reflect an intersection of physiological demands, travel logistics, and competitive structures. Data gathered across basketball, hockey, and other sports illustrates consistent relationships between rest intervals and performance indicators, while league-specific adaptations continue to evolve. Ongoing research from academic and sports medicine institutions supplies additional context for understanding these dynamics as calendars progress through 2026 and beyond.