Linking Recovery Periods to Efficiency Drops During NBA Schedule Congestion Periods
Written by Kai Griffin · May 21, 2026
Linking Recovery Periods to Efficiency Drops During NBA Schedule Congestion Periods
The NBA regular season stretches across six months with 82 games per team, yet the league packs many contests into tight windows that leave little room for rest, and observers note how these periods of congestion directly correlate with measurable drops in player efficiency ratings and shooting accuracy. Teams travel across time zones while playing on consecutive nights or within three-in-four-night sequences, which limits the hours available for sleep, physical therapy, and mental reset.
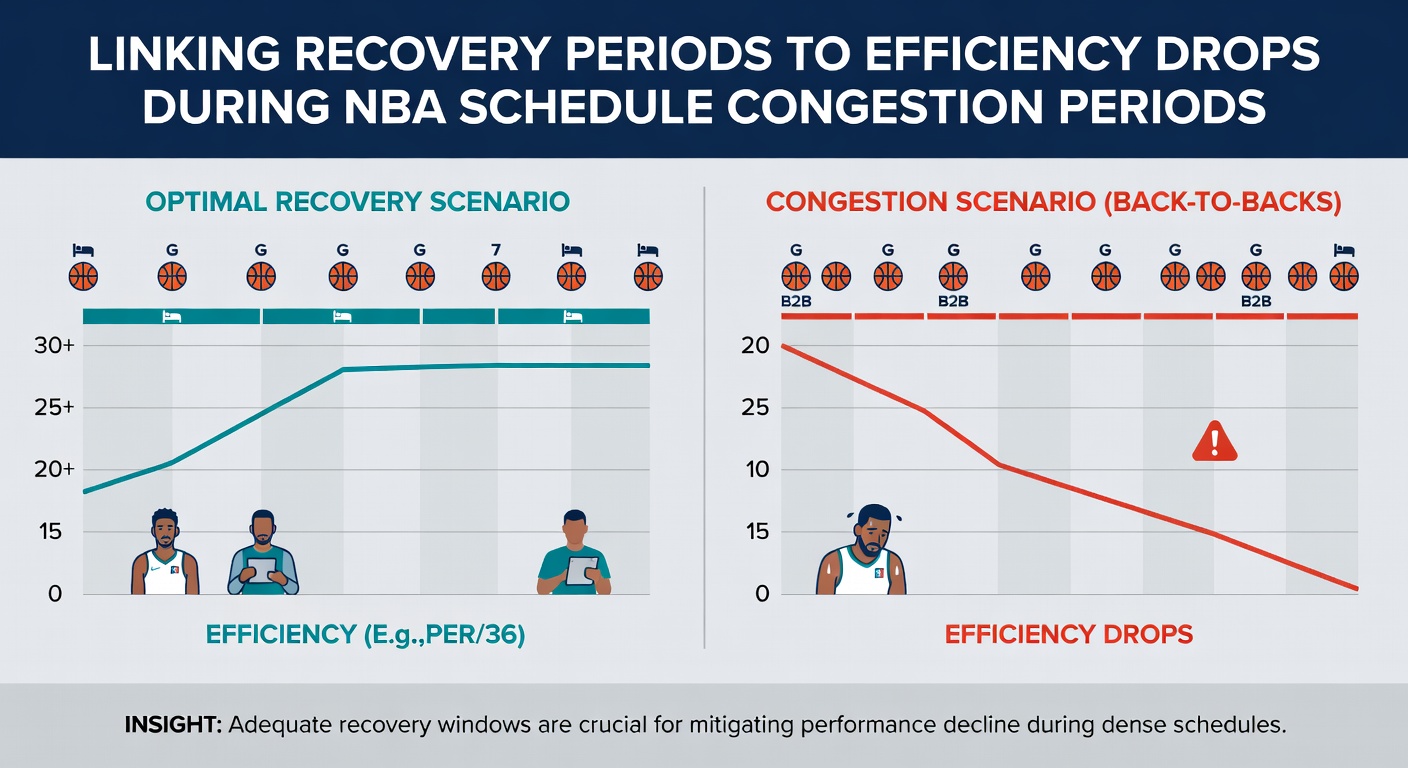
Data from the 2025-26 campaign illustrates the pattern clearly. Squads that encountered four or more back-to-back sets between January and March posted average declines of 3.2 points in player efficiency rating compared with their season baselines, while true shooting percentages fell by roughly 2.8 percent during those stretches according to aggregated box-score analysis.
Defining Schedule Congestion and Its Physical Toll
Schedule congestion arises when the league calendar forces clubs into dense clusters of games separated by minimal off days, and analysts track these clusters by counting games played with two or fewer days of rest. The 2025-26 slate featured 14 teams that logged at least 12 such low-rest games before the All-Star break, with several Western Conference clubs logging even higher totals because of cross-country travel demands.
Researchers tracking heart-rate variability and sleep metrics have documented how cumulative fatigue builds across these windows. A report issued by the Australian Institute of Sport examined wearable data from professional basketball athletes and found that recovery scores dropped below baseline thresholds after three consecutive low-rest games, with neuromuscular function taking an average of 48 hours to return to optimal levels.
Efficiency Metrics That Reveal the Impact
Player efficiency rating, true shooting percentage, and assist-to-turnover ratio serve as primary indicators that reveal how rest shortages affect on-court output. During congested periods in the 2025-26 season, guards and wings showed the steepest declines in true shooting percentage, often falling from season averages near 58 percent to the low 53 percent range when playing on zero or one day of rest.
Frontcourt players experienced parallel reductions in rebounding efficiency and defensive box plus-minus, with several starting centers posting defensive ratings that worsened by more than five points per 100 possessions after back-to-back sets. These shifts occurred even among teams that maintained consistent lineups, suggesting the drops stemmed from physical and cognitive fatigue rather than roster changes alone.
Recovery Windows and Their Measurable Effects
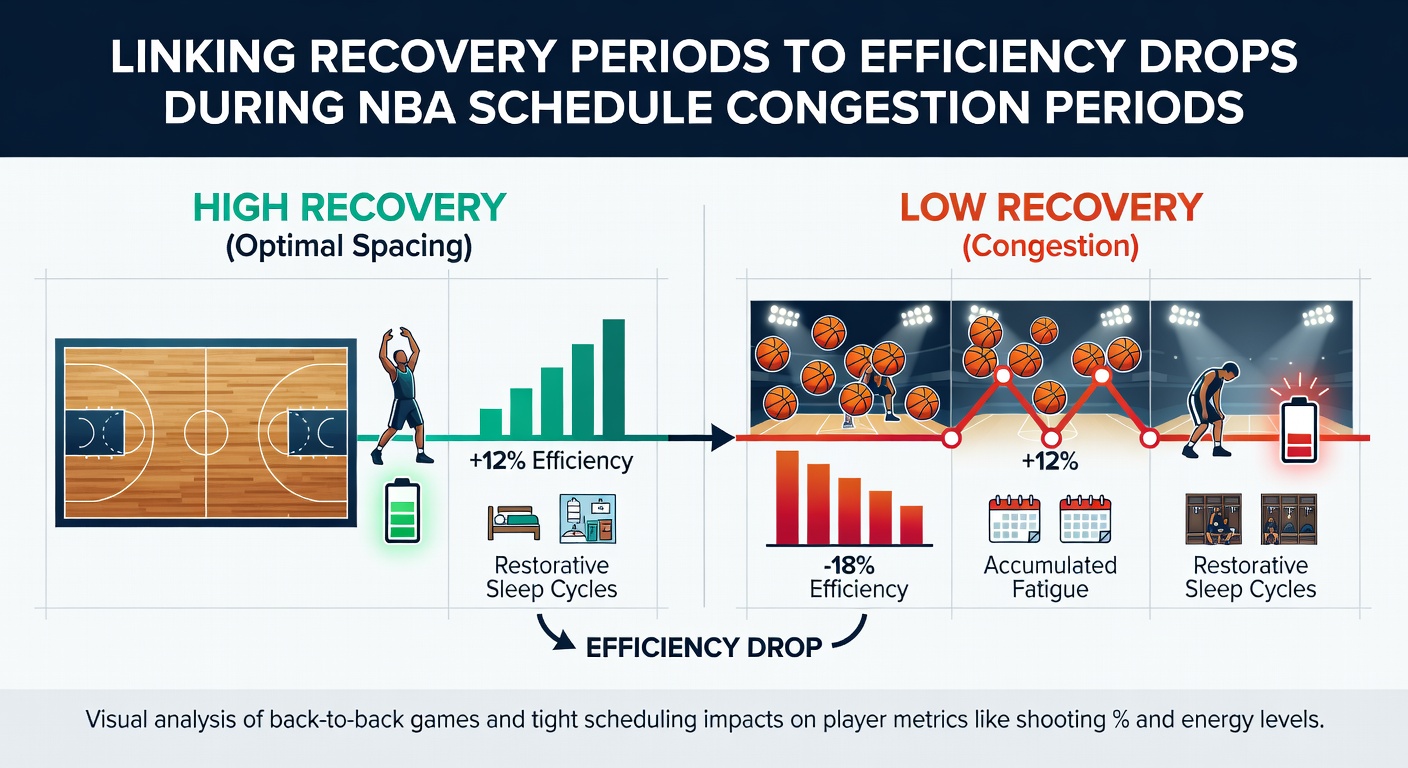
Teams that secured at least two full days between games during the 2025-26 regular season maintained efficiency ratings within 1.1 points of their established norms, while squads limited to single-day gaps saw average drops exceeding 4 points. The difference became most pronounced in the fourth quarters of the second game in a back-to-back, where offensive efficiency fell by an average of 8.4 points per 100 possessions according to play-by-play logs.
Studies conducted by sports-science groups at North American universities have isolated the role of sleep duration in these outcomes. Athletes averaging fewer than six hours of sleep on travel nights recorded reaction-time delays of 12 percent and reduced three-point accuracy of 4.7 percentage points in subsequent contests, figures that align closely with observed efficiency dips during schedule congestion.
Patterns Observed Heading Into the 2026 Postseason
As May 2026 approached and playoff positioning intensified, several clubs that had navigated heavy March schedules entered the postseason with lingering efficiency shortfalls. One Eastern Conference team that played 11 games in 17 days during late March posted a 6.3-point drop in net rating during its first-round series compared with its regular-season mark, and advanced metrics attributed much of the decline to reduced second-unit production after starters logged heavy minutes without adequate recovery intervals.
League-wide tracking shows that teams entering the playoffs with fewer than three low-rest games in the final month of the regular season preserved their regular-season offensive efficiency at a higher rate than clubs forced to play compressed schedules right up to the postseason cutoff.
League-Wide Responses and Scheduling Adjustments
The NBA has introduced targeted reductions in back-to-back sets over recent seasons, yet congestion persists in certain markets because of arena availability and broadcast requirements. Data released through the league’s player health and performance initiative indicates that the average number of games played on zero days’ rest declined from 4.8 per team in 2018-19 to 3.1 per team in 2025-26, yet the remaining low-rest games still coincide with statistically significant efficiency reductions.
Coaching staffs now incorporate load-management protocols that rest key players during the second game of a back-to-back when the schedule permits, and these decisions have produced measurable stabilization in efficiency numbers for those specific lineups. The approach remains uneven across the league because of competitive pressures and roster depth variations.
Conclusion
Evidence accumulated across multiple NBA seasons demonstrates a consistent statistical link between abbreviated recovery periods and subsequent drops in efficiency metrics during schedule congestion. As the league continues to refine its calendar, the data collected through the 2025-26 campaign and into the May 2026 playoffs underscores how even modest increases in rest windows can preserve performance baselines for teams navigating the longest stretch of the year.