Humidity Swings Reshaping Baseball Totals Markets Through Pitch Movement Data
Written by Rafael Beck · Jul 30, 2026

Humidity Swings Reshaping Baseball Totals Markets Through Pitch Movement Data
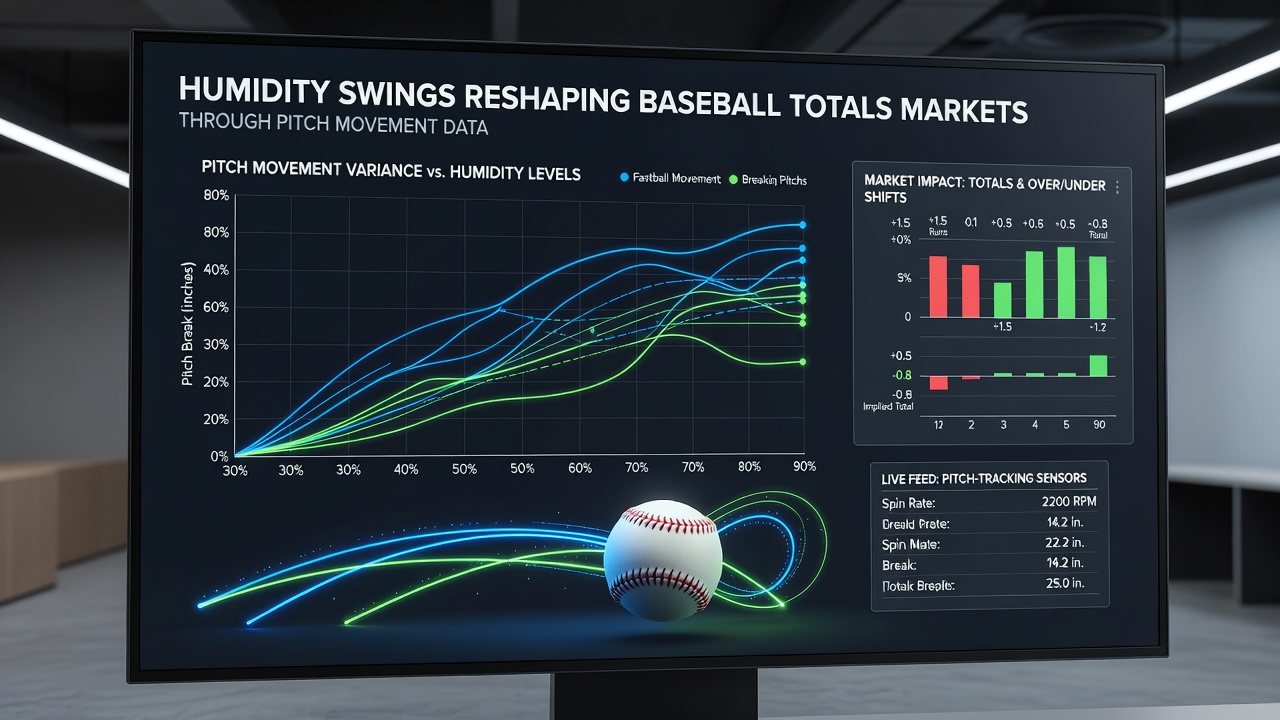
Baseball totals markets have shown measurable shifts in recent seasons as analysts incorporate humidity readings into pitch movement models, and data from multiple stadiums indicate that daily moisture levels alter how far and how sharply pitches break before reaching the plate. Researchers tracking Statcast metrics across 2025 and into July 2026 documented consistent correlations between relative humidity drops and changes in horizontal and vertical movement on sliders and curveballs, which in turn influence run totals and over-under pricing.
Air Density and Pitch Flight Paths
Atmospheric scientists explain that water vapor displaces heavier nitrogen and oxygen molecules, so higher humidity reduces overall air density and decreases the aerodynamic forces acting on a spinning baseball. Lower humidity produces denser air that amplifies Magnus effect forces, causing greater break on breaking pitches, whereas elevated moisture levels flatten trajectories and reduce late movement. Observers tracking games in arid markets such as Denver and Phoenix note that these density changes appear most pronounced during afternoon starts when temperature and humidity diverge sharply from morning readings.
Market Adjustments in Totals Betting
Betting exchanges and sportsbooks have begun embedding real-time humidity forecasts into their totals algorithms, and figures from July 2026 show sharper line movements on days when models predict humidity swings exceeding fifteen percent between first pitch and the seventh inning. Data providers supplying pitch-tracking services report that teams and oddsmakers now cross-reference local weather station outputs with historical movement databases to refine over-under projections, particularly in venues where retractable roofs create rapid indoor-outdoor transitions. Those who monitor sharp action observe that totals lines in low-humidity environments tend to open higher because reduced break leads to more contact and extra-base hits.
Case Examples From Recent Seasons
One dataset compiled across National League parks during the 2025 campaign revealed that games played when relative humidity fell below forty percent produced run totals averaging 0.8 runs above the season-long mean, while contests above seventy percent humidity stayed closer to or below projected scoring. Analysts reviewing Statcast spin-efficiency numbers found that four-seam fastballs lost between two and four inches of vertical movement in drier conditions, allowing hitters more time to square up pitches that would otherwise induce weak contact. Similar patterns emerged in American League outdoor venues during early summer 2026 when prolonged dry spells coincided with elevated slugging percentages and higher totals payouts.
Integration of Weather Data Streams
Operators now pull hourly readings from networks maintained by the National Oceanic and Atmospheric Administration and combine them with venue-specific barometric pressure trends to refine pitch-movement forecasts. Academic teams at institutions studying sports aerodynamics have published models demonstrating that a ten-percent humidity swing can alter curveball drop by as much as three inches, enough to shift expected batting averages on balls in play. These models feed into proprietary pricing engines that sportsbooks use to adjust totals within minutes of updated weather bulletins.
Regional Variations and Roof Effects
Stadiums with fixed roofs exhibit smaller humidity-driven swings because mechanical systems maintain stable indoor conditions, yet open-air parks in the Midwest and Northeast display pronounced effects when cold fronts or heat waves alter moisture content rapidly. Canadian researchers examining Toronto and Montreal data sets noted that lake-effect humidity changes produce distinct morning-to-evening patterns that differ from those observed in drier western climates. Figures released by industry analytics groups indicate that totals markets in these variable regions require more frequent line updates, and sharp bettors have increased their monitoring of pre-game humidity differentials to time wagers.
Future Data Refinements
Advancements in portable humidity sensors installed along foul lines are expected to supply granular readings that further tighten correlations between moisture and pitch outcomes. Partnerships between tracking providers adn meteorological agencies aim to deliver minute-by-minute forecasts that integrate with existing pitch-tunnel visualizations, allowing more precise adjustments to over-under markets. Observers tracking these developments note that the combination of denser environmental data and refined movement algorithms continues to narrow the gap between projected and actual scoring across diverse ballpark conditions.
Conclusion
Humidity fluctuations now form a recognized variable within baseball totals pricing frameworks, and the growing availability of pitch-movement metrics tied to real-time weather inputs has produced measurable market responses. Continued collection of stadium-level data through 2026 and beyond will likely sustain this integration as operators seek incremental edges in run-total projections.