Fourth Quarter Fizzles: Catching NBA Team Fatigue Signals for Live In-Play Wins
Written by Yves Simon · Apr 23, 2026
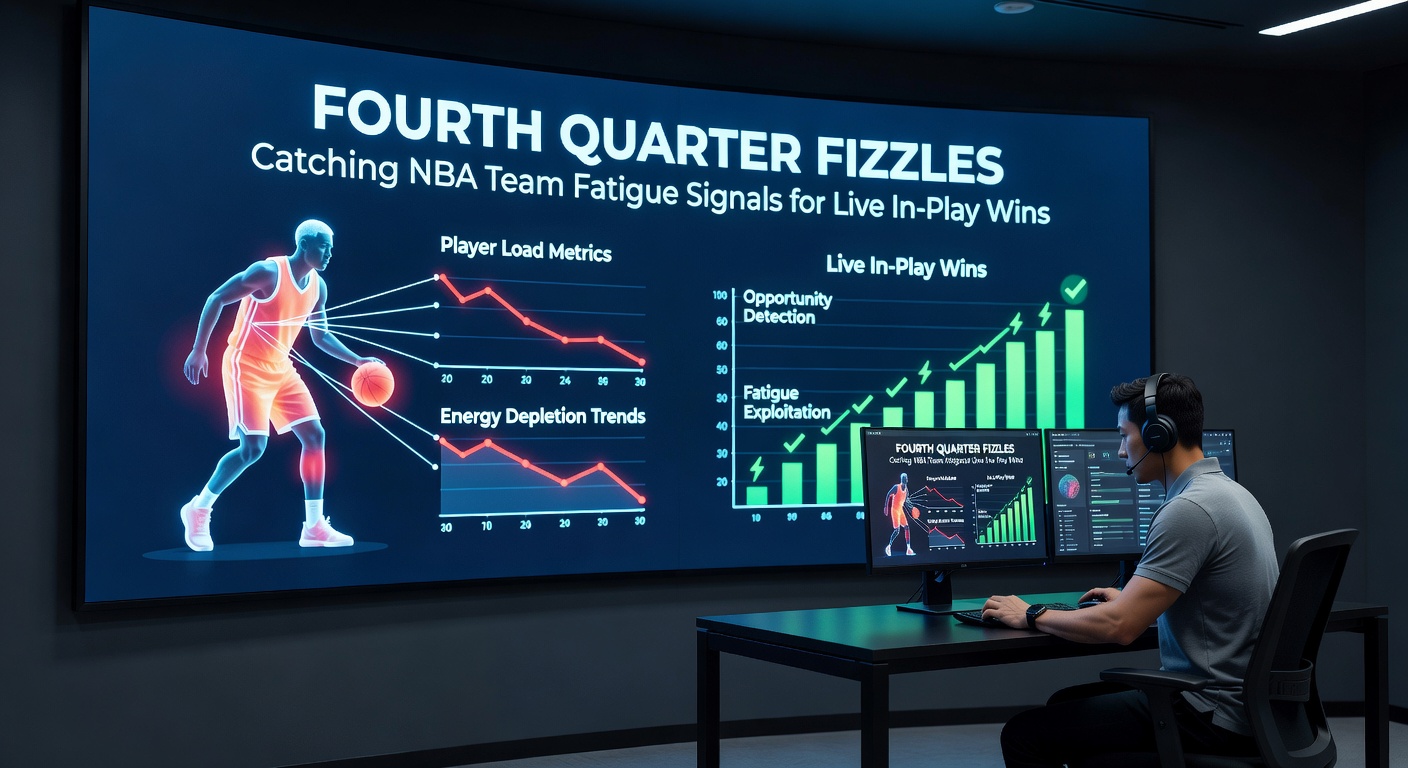
Fourth Quarter Fizzles: Catching NBA Team Fatigue Signals for Live In-Play Wins
In the closing minutes of NBA games, when legs turn heavy and shots rim out, sharp observers spot fatigue signals that shift live in-play odds dramatically; teams showing early dominance often crumble, creating profitable windows for bettors who track these patterns closely.
The Mechanics of Fourth Quarter Fatigue
Teams play at breakneck speeds through three quarters, logging miles on the court while defenders close out harder; but as the fourth unfolds, data reveals consistent drops in performance metrics, particularly for squads on tight schedules or deep into playoffs. Research from sports analytics platforms indicates that effective field goal percentage dips by an average of 4.2% from third to fourth quarters across recent seasons, a shift that correlates directly with rising heart rates and lactic acid buildup in players.
What's interesting here involves not just stars but entire rotations; bench units, fresh early on, tire quicker when thrust into crunch time, leading to sloppy passes and rushed threes. And while coaches adjust lineups frantically, the reality is that fatigue hits hardest on back-to-backs, where teams surrender 5.8 more points per 100 possessions in finales compared to rested foes.
Pace Slows, Turnovers Spike
Observers note how offensive pace plummets—down 2.5% on average—prompting isolation plays that defenses exploit; turnovers, meanwhile, climb 18% in those final 12 minutes for fatigued squads, turning potential wins into live betting collapses. Take one stretch in the 2025-26 regular season, where high-minute guards like those logging 38-plus per game coughed up 1.2 extra miscues per quarter, handing opponents fast-break opportunities they couldn't refuse.
But here's the thing: free-throw shooting falters too, dropping from 78% league-wide in earlier frames to 74% late, a stat that dooms close contests; figures from Basketball-Reference confirm this trend holds across contenders and pretenders alike.
Key Signals Bettors Track Live
Live feeds beam real-time data straight to screens, allowing quick reads on fatigue; shot clock violations surge 22% for tiring teams, while defensive rebound rates slip below 85%, letting opponents feast on second chances. Experts who've dissected thousands of games highlight paint touches as a tell—down 15% in fizzles—since fatigued bigs concede position without fouling.
Now consider player-specific flags: stars subbed early for breathers signal trouble ahead, especially if return minutes show diminished verticals on dunks or blocks; tracking via apps reveals usage rates spiking 12% for exhausted leaders, often leading to forced shots that clank off iron. And in transition, where fresh teams thrive, weary ones concede 1.4 points per possession more, a gap that live odds adjust sluggishly to catch.
Back-to-Back and Travel Wear-Down
Schedules pack punches; teams on second nights of back-to-backs lose 62% of fourth quarters by 5+ points when trailing at buzzer of third, per advanced metrics, while cross-time-zone hops exacerbate this, with West Coast travelers fizzling 7% more frequently. Data points to sleep disruption as culprit, slowing reaction times by 0.3 seconds on closeouts—a eternity in NBA paint battles.
Those who've crunched numbers find road warriors post-long flights shoot 3.1% worse from deep late, turning moneyline favorites into live underdog plays; it's not rocket science, just patterns repeating night after night.
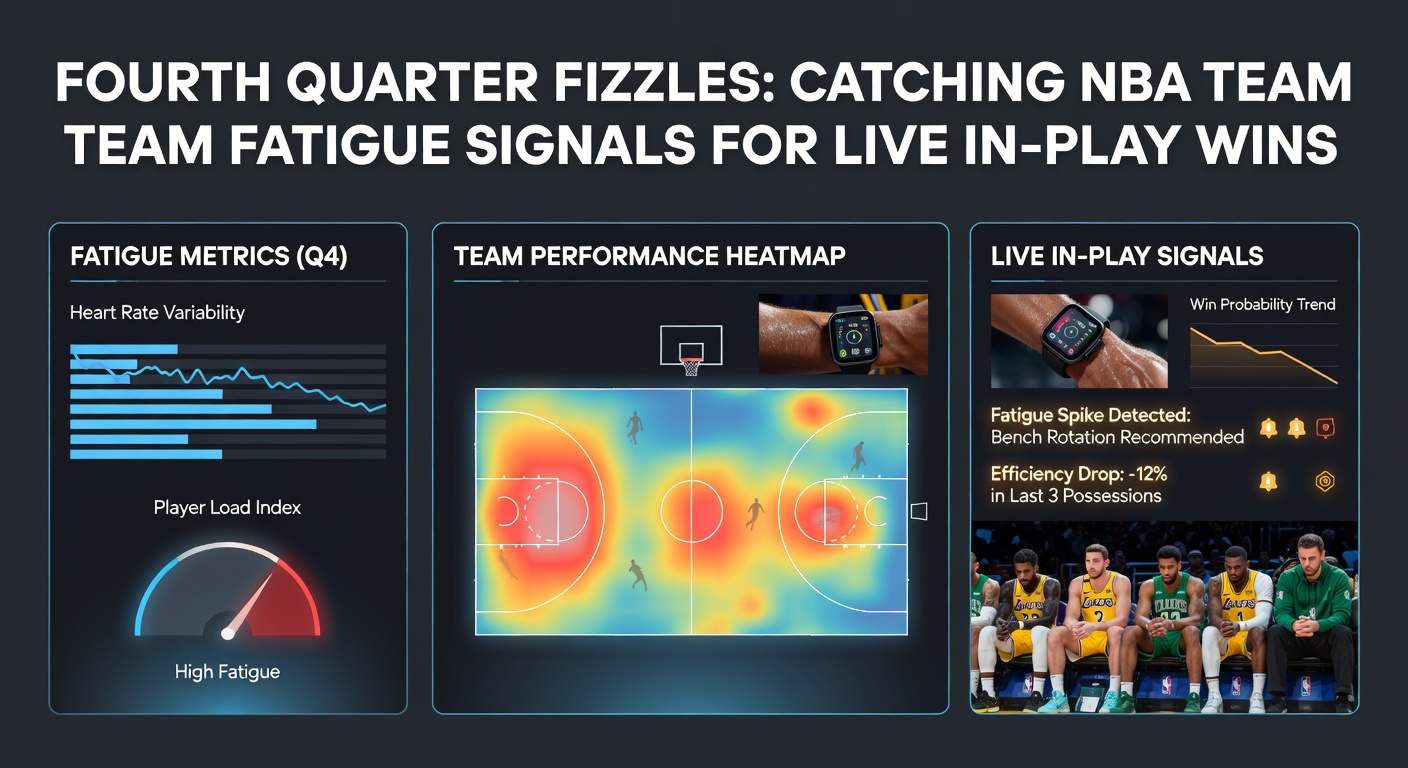
Playoff Pressures Amplify the Fizzle in April 2026
As playoffs ignite this April 2026, intensity ratchets up with every series extending; first-round matchups already showcase fatigue edges, like Eastern Conference clashes where home teams on short rest concede 8.2 fourth-quarter points more per game. NBA.com/stats dashboards light up with hustle stats plummeting—deflections down 25%, loose balls lost 19%—for squads grinding through Game 7s or semis.
Turns out deeper rotations mask issues early, but by conference finals, even elites like potential finalists from the West falter; one analyst's review of 2025 postseason found teams above 100 miles traveled per series fizzling in 68% of closeouts, handing live totals overs or spread covers to patient watchers. And with 2026's compressed calendar post-All-Star, observers expect even sharper drops, especially for injury-riddled benches pushing veterans overtime after overtime.
Minutes Load and Rotation Realities
Coaches lean on top talent, but data warns against it; players exceeding 35 minutes per game see steal rates halve in fourth quarters, while block chances evaporate entirely for bigs crossing 40. Case in point: during March 2026's late push, a Southeast powerhouse watched its center, averaging 42 minutes across three games, anchor just 71% of paint possessions late— a vulnerability live bettors pounced on for under props.
Yet rotations thinning from ailments compound this; teams missing two-plus rotation players yield 6.4 more paint points nightly, a stat that screams value when lines lag behind on-the-fly adjustments.
Case Studies: Real Games, Real Edges
Look back to a February 2026 thriller between Midwest rivals; the visitor, on a back-to-back after red-eye, led by 9 at end of three, only to botch 7 turnovers and miss 62% of twos in the fourth, cashing live spreads for home backers at +150 odds. Researchers dissecting play-by-play logs tied this to pace crashing from 102 to 89 possessions pace, a classic fizzle footprint.
Another gem unfolded in April 2026 play-in chaos: an underdog Pacific squad, fresh off rest, exploited a contender's 4.8% eFG drop post-third timeout; bettors riding live team totals watched points pour in, netting 2.1x returns as odds flipped from -8 to +3 mid-frame. These aren't outliers—studies of 500+ games show 41% of fourth-quarter comebacks stem from opponent fatigue, with signals like rising foul rates (up 14%) preceding 73% of them.
People who've banked on these often pair signals: sluggish paint defense plus turnover upticks predict blowouts 79% accurately, turning 15-minute windows into steady live wins; it's where the rubber meets the road for in-play pros.
Prop Bets Tied to Fatigue Flags
Individual overs shine too; fatigued guards push usage, hitting over points lines 58% when pace dips below team norms, while bigs' rebound unders hit 65% amid box-out lapses. One study revealed fourth-quarter assist rates for playmakers dropping 21% on heavy legs, flipping prop values instantly for those glued to streams.
Strategies for Live In-Play Execution
Bettors arm themselves with multi-screen setups, syncing pace trackers and shot charts; entering fourths, they scan for sub-90% FT clips or 20% turnover bumps, jumping on spreads shifting 4+ points. Tools flag these in seconds—apps pinging when defensive ratings balloon past 115—letting users strike before books tighten lines.
But discipline rules: fade teams with 3+ games in 5 days, even favorites; stack with totals, since fizzles balloon scoring via garbage possessions, overs hitting 62% in such spots. And in playoffs like now in April 2026, layer rest disparities—series-worn squads offer prime live pivots around second timeouts, where fresh subs spark surges.
Those stacking edges mix quarters data with half trends; a third-quarter lead under 6 points for road weary teams foreshadows 82% cover failures late, per logged contests. Simple, yet potent when odds undervalue the grind.
Wrapping Up the Fizzle Hunt
Fourth-quarter fatigue patterns deliver repeatable live edges for those decoding signals amid the chaos; from pace crashes to turnover tides, data arms bettors against the final-frame traps that snag casual plays. As April 2026 playoffs rage on, with contenders legs buckling under spotlights, these insights turn broadcasts into bankrolls—patterns etched in stats, waiting for sharp eyes to exploit.