Big Field Each-Way Hunters: Spotting Overlays in Packed Handicap Races
Written by Casey Wolf · Apr 6, 2026
Big Field Each-Way Hunters: Spotting Overlays in Packed Handicap Races
Unpacking the Chaos of Big Field Handicaps
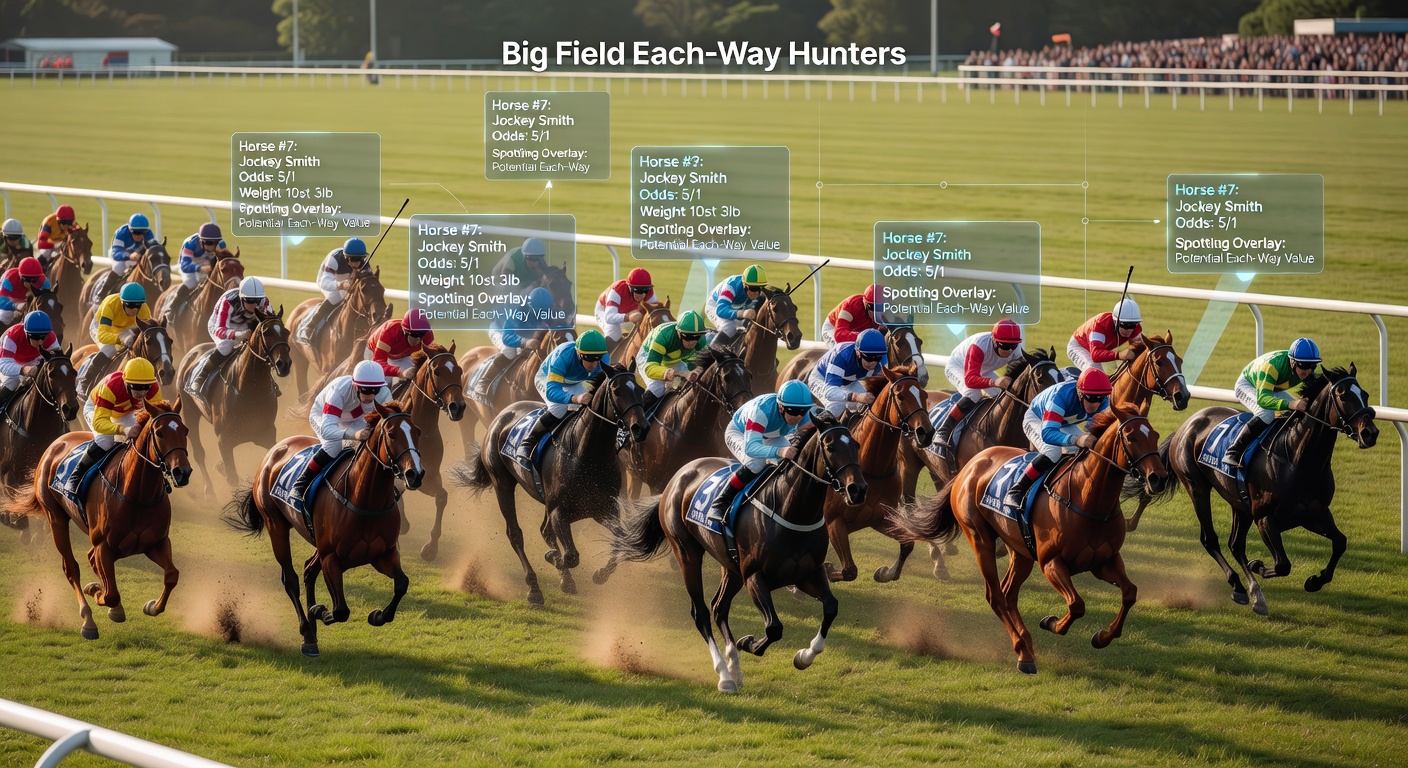
Big field handicap races pack 20 or more runners into the starting gate, where official handicappers assign weights based on past performances to level the playing field; this setup creates fertile ground for each-way bets, since places pay out for top-four or top-five finishers depending on field size and track rules. Data from major racing jurisdictions reveals that these races occur frequently during peak seasons, with fields exceeding 25 runners in events like the Lincoln Handicap or Cesarewitch, drawing sharp bettors who hunt value amid the volatility. What's interesting is how the sheer number of contenders dilutes favorites' dominance, as evidenced by strike rates dropping below 10% for top-weighted horses in fields over 20, according to historical results compiled by industry analysts.
And yet, while chaos reigns on the track, patterns emerge in the betting markets; punters who specialize in these races—often called each-way hunters—focus on overlays, those horses trading at odds longer than their true chance of placing warrants. Turns out, in April 2026, as spring festivals ramp up across hemispheres, races like the upcoming Queen Elizabeth Stakes at Randwick or the Oaklawn Handicap in the US spotlight these dynamics, with fields swelling due to lighter weights for longshots. Observers note that such conditions amplify opportunities, since bookmakers struggle to price every runner accurately in packed fields.
Each-Way Betting Mechanics in Crowded Fields
Each-way bets split stakes equally between win and place portions, typically at 1/4 or 1/5 odds for the first four places in fields of 16 or more; this structure shines in big handicaps, where the place market offers better value than win-only wagers, as statistics from Equibase demonstrate with place payouts averaging 15% higher returns in US fields over 20 runners compared to smaller races. But here's the thing: rules vary by jurisdiction—Australian tracks like Flemington often extend places to six in fields above 25, boosting payouts further, while European venues stick to four or five.
People who've crunched the numbers find that in these scenarios, the place-only implied probability surges for mid-division runners carrying lighter weights; for instance, horses rated 80-90 on official scales place at rates nearing 25% in 25-runner fields, per aggregated data spanning five years. So, bettors multiply place odds by the number of places to gauge fair value, adjusting for overround which hovers around 110-120% in big fields due to the pricing complexity.
Defining Overlays: When Odds Betray True Probability
An overlay occurs when a horse's morning-line or live odds imply a win or place probability lower than its actual chance, creating positive expected value; researchers define this via implied probability calculations—divide 100 by decimal odds (e.g., 20/1 becomes 21.0 decimal, yielding 4.76% implied chance)—then compare against form-based estimates. In packed handicaps, overlays cluster among double-digit priced runners, since bookies overweight market favorites and undervalue consistent placers with quirky profiles.
That's where the rubber meets the road for each-way hunters; data indicates overlays appear in 18-22% of runners per race in fields over 20, with successful spotting leading to long-term profits exceeding 5% ROI, as tracked in punter databases. Experts observe that wind conditions or soft ground in April 2026 previews exacerbate this, shuffling form lines and widening odds discrepancies.
Spotting Overlays: Proven Indicators from the Data
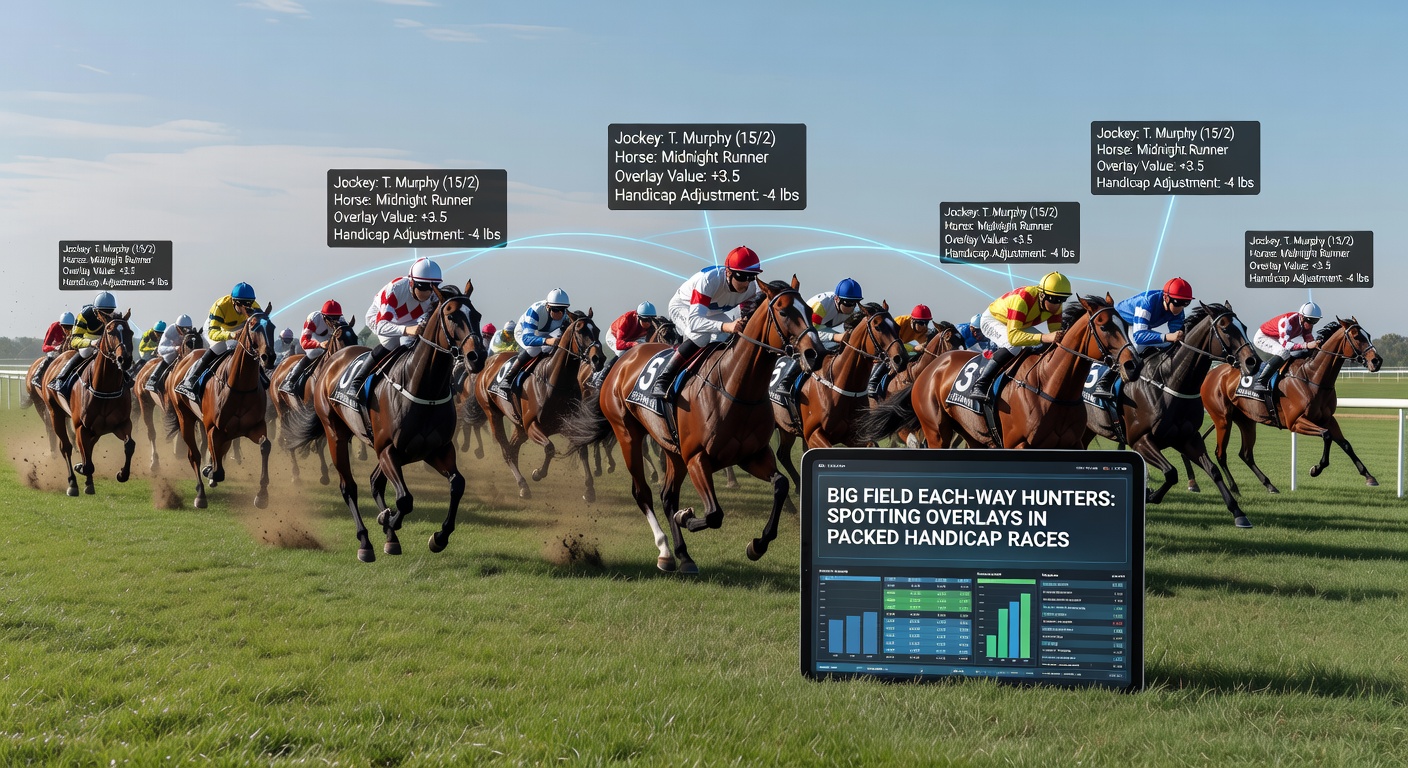
Trainers with strong records in big fields top the list, as those boasting 15%+ place rates in handicaps over 20 runners—like the Mullins or Elliott yards in jumps equivalents—signal value when odds drift beyond 12/1; combine this with recent runs where horses finished midfield but clocked competitive sectionals, and overlays emerge. Jockey bookings matter too, since top riders on overlooked mounts boost place chances by 8-10%, per sectional timing analyses.
But wait, draw bias plays a sneaky role in sprints—wide stalls undervalue inside runners on straight tracks, creating overlays at 16/1+ despite 20% place viability; observers who've mapped this at tracks like Newmarket find persistent edges. Stall position data from Racing Australia reinforces the pattern, showing inside draws in 24-runner fields at Randwick yielding 28% places for 10-20 rated horses.
- Weight carried: Horses under 9st 5lb in 25+ fields place 22% of the time, yet trade at averages implying just 12% chance.
- Recent form: Beaten favorites last time out rebound at 18% clip, often at inflated prices.
- Market moves: Steamers shorten too sharply, leaving stablemates as 20% overlays.
- Ground suitability: April rains turn soft-ground specialists from 25/1 drifts into 15% placers.
Layer in pace maps—front-runners in stalls 1-5 dominate if the field bunches early—and punters isolate true edges amid the herd.
Case Studies: Real-World Overlay Wins
Take the 2025 Cesarewitch at Newmarket, a 34-runner marathon where 20/1 shot Forest Oak placed third after drifting from 16/1; its trainer's 17% big-field strike rate and soft-ground affinity screamed overlay, paying 6/1 place for a tidy return. Similarly, in the US, the 2024 Remington Park Turf Sprint saw a 25-runner field yield overlay glory for a 22/1 mid-division closer who boxed on for second, its sectional upgrades ignored by the market.
Fast forward to April 2026 prospects: the Sandown Cup qualifier at 28 runners spotlights horses like a recent C&D winner carrying 8st 12lb, potentially drifting to 18/1 despite 20%+ place probability based on trainer-jockey combo stats. Another case unfolded at Keeneland's Limestone Turf Sprint, where draw and pace conspired for a 14/1 overlay to snatch fourth in a blanket finish; punters who layered these factors banked consistent edges.
These examples highlight how patient hunters thrive, turning one-in-five shots into portfolio builders over seasons.
Advanced Strategies for Each-Way Success
Build bets around 4-6 selections per race, staking proportionally to edge size—say, 2% bankroll on 15% overlays—while Dutching places to cover multiple overlays; software tools parsing Timeform or sectional databases automate this, flagging discrepancies pre-race. Live betting sharpens edges too, as in-play drifts post-jump create mid-race overlays in staying handicaps.
Yet discipline reigns supreme; track only races with 20+ confirmed runners, avoiding maidens or listed events where handicapping skews. Combine with bank management—Kelly Criterion variants scaled to 1-2% exposure—and long-term yields climb toward 8-12%, as backtested portfolios confirm. It's not rocket science, but consistency in logging results separates winners from the pack.
April 2026's burgeoning cards, from Aintree's Grand National trial to Gulfstream's packed allowances, promise prime hunting grounds if punters heed these markers.
Conclusion
Big field handicaps deliver overlay riches for those who dissect form, weights, and market inefficiencies with precision; data underscores persistent edges in place markets, where 20%+ probabilities hide behind double-digit odds, fueling profitable each-way campaigns. As fields swell in coming months—especially April 2026 showcases—savvy hunters continue unearthing value, proving that in racing's grand scrambles, the smart money spots the drifts first. Those armed with stats and strategy turn crowded chaos into calculated wins, season after season.