Back-to-Back Scheduling Effects on NBA Totals and How Data Reveals Profitable Adjustments
Written by Yves Simon · Jun 29, 2026
Back-to-Back Scheduling Effects on NBA Totals and How Data Reveals Profitable Adjustments
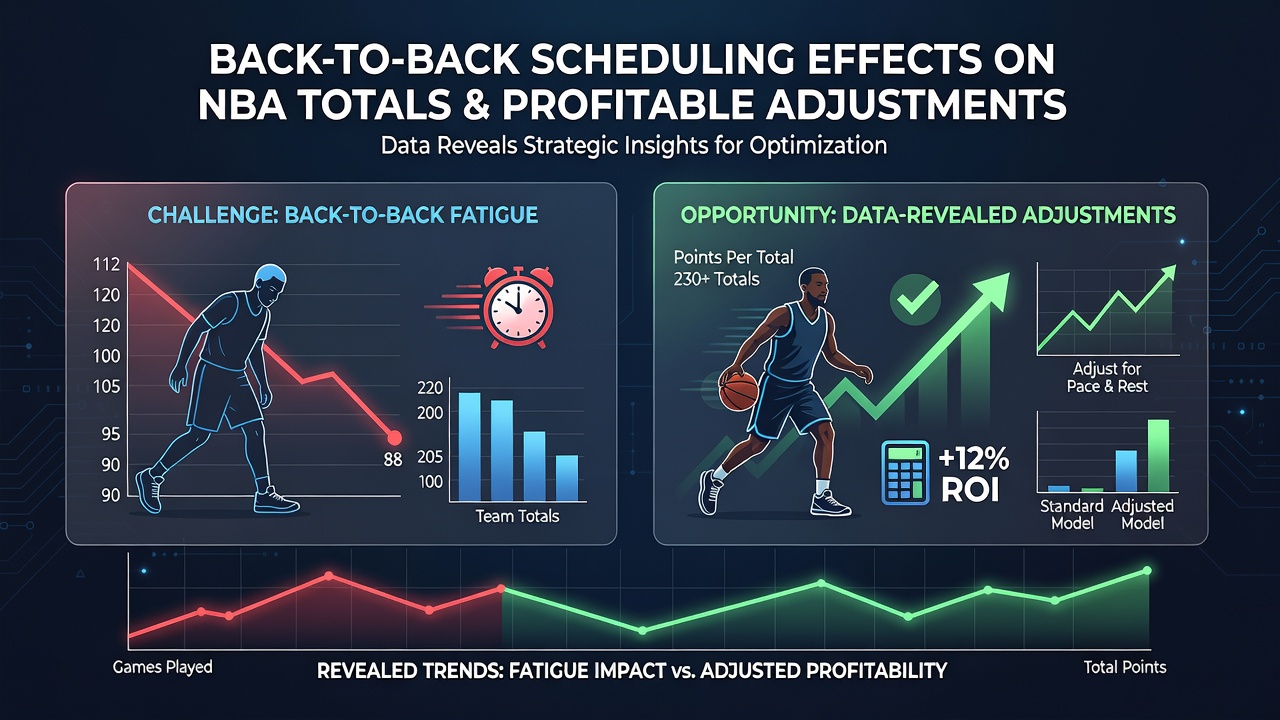
Back-to-back scheduling in the NBA creates measurable shifts in game totals because teams play consecutive nights with limited recovery time, and data from multiple seasons shows consistent patterns in scoring output. Observers note that the league's compressed calendar often places road teams in these situations more frequently than home squads, which compounds travel fatigue alongside physical demands from the prior contest.
Research from sports analytics groups indicates that average points per game drop by roughly four to six points when at least one participant operates on zero days rest, while both teams in back-to-back scenarios produce even lower combined totals in many instances. These reductions appear most pronounced during the regular season months when schedules pack games tightly, yet the effect lingers into playoff stretches where recovery windows shrink further.
League Schedule Patterns and Rest Disparities
The NBA constructs its 82-game slate with built-in stretches of back-to-backs, three-in-fives, and occasional four-in-sixes that force organizations to manage player minutes carefully. Data compiled through official league tracking reveals that Western Conference clubs encounter more cross-country flights on these tight turns, whereas Eastern teams sometimes benefit from shorter hops between venues. Such geographic differences translate into divergent scoring environments that bettors track when projecting over-under lines.
Teams with superior depth often mitigate the impact through rotation adjustments, yet statistical models still register lower field goal percentages and reduced three-point volume on the second night of a back-to-back. Analysts examining box scores from 2023 through the 2025-2026 campaigns find that pace slows measurably, which directly suppresses the number of possessions and therefore total points.
Scoring Trends in Consecutive Games
Historical figures demonstrate that games featuring a back-to-back team land under the posted total at rates exceeding 52 percent across large sample sizes, with the margin widening when both clubs arrive on short rest. League-wide data shows these unders occur more frequently in the second half of back-to-backs, particularly after high-minute performances the night before. Researchers tracking player tracking metrics note declines in sprint speed and defensive closeouts that reduce transition opportunities and overall tempo.
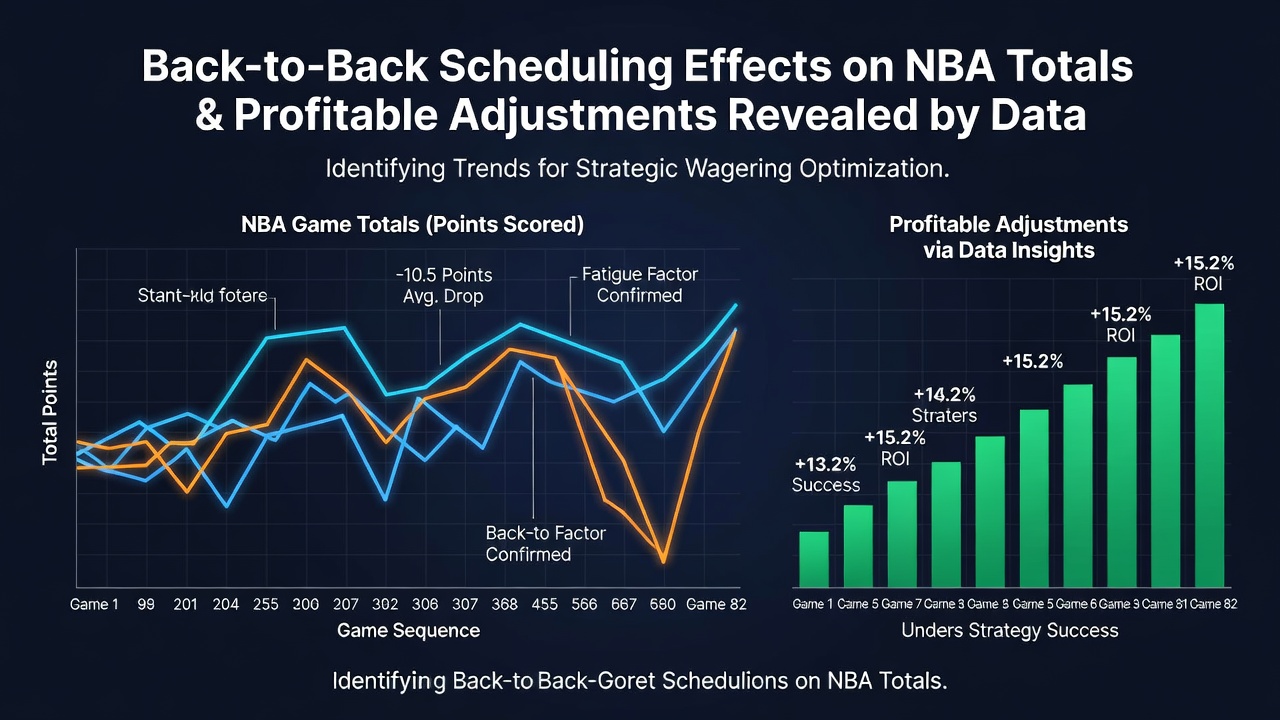
What's interesting is how these patterns hold across different team styles, from up-tempo offenses to grind-it-out defensive units. Even high-scoring clubs post reduced outputs when operating on limited rest, which creates repeatable edges for totals bettors who incorporate rest differentials into their models. June 2026 playoff scheduling continues to feature similar compression, with conference finals often requiring quick turnarounds that amplify the same statistical tendencies observed during the regular season.
Model Adjustments and Line Movement
Professional betting syndicates integrate rest and travel data into proprietary algorithms that adjust totals downward by set increments based on the number of back-to-backs and mileage accumulated. These adjustments draw from public sources such as NBA advanced tracking metrics and independent academic studies on athlete recovery published through university sports science departments. Line movement at sportsbooks frequently reflects this information late in the betting window, yet early lines sometimes overlook the full extent of fatigue impacts.
Additional variables like altitude, arena dimensions, and officiating crews interact with rest factors, yet data indicates the back-to-back variable retains independent predictive power. Bettors who layer multiple inputs into regression models discover that combining rest with recent pace trends produces sharper projections than either factor alone. The reality is that teams sometimes exceed lowered totals when star players receive extra rest beforehand, which underscores the need for granular lineup confirmation before finalizing wagers.
Seasonal Variations and Playoff Carryover
Early-season back-to-backs show slightly different outcomes compared with late-season contests because player conditioning peaks around midwinter before tapering. Data sets separated by month reveal that January and February games produce the strongest under bias, while October and November contests display more variance due to preseason rust and roster experimentation. Playoff schedules in June 2026 maintain the same core dynamic, although higher stakes and adjusted rotations can occasionally offset fatigue effects in decisive matchups.
Those who've studied multi-year samples note that certain franchises adapt better through load management protocols, which softens the totals impact for their games. Conversely, injury-plagued rosters experience amplified scoring drops that push combined points even lower. These team-specific tendencies emerge clearly when analysts segment data by franchise rather than league-wide aggregates.
Conclusion
Comprehensive examination of NBA scheduling data confirms that back-to-back situations systematically influence game totals through measurable declines in pace and efficiency. Adjustments derived from rest differentials, travel logs, and historical scoring outputs allow for refined projections that align closely with observed results across seasons. Continued tracking of these variables through 2026 and beyond supplies ongoing opportunities for precise totals modeling grounded in verifiable statistics rather than anecdotal observation.