Analyzing Travel Fatigue Patterns in Cross League Schedules for Multi Event Wagers
Written by Rafael Beck · Jun 15, 2026
Analyzing Travel Fatigue Patterns in Cross League Schedules for Multi Event Wagers
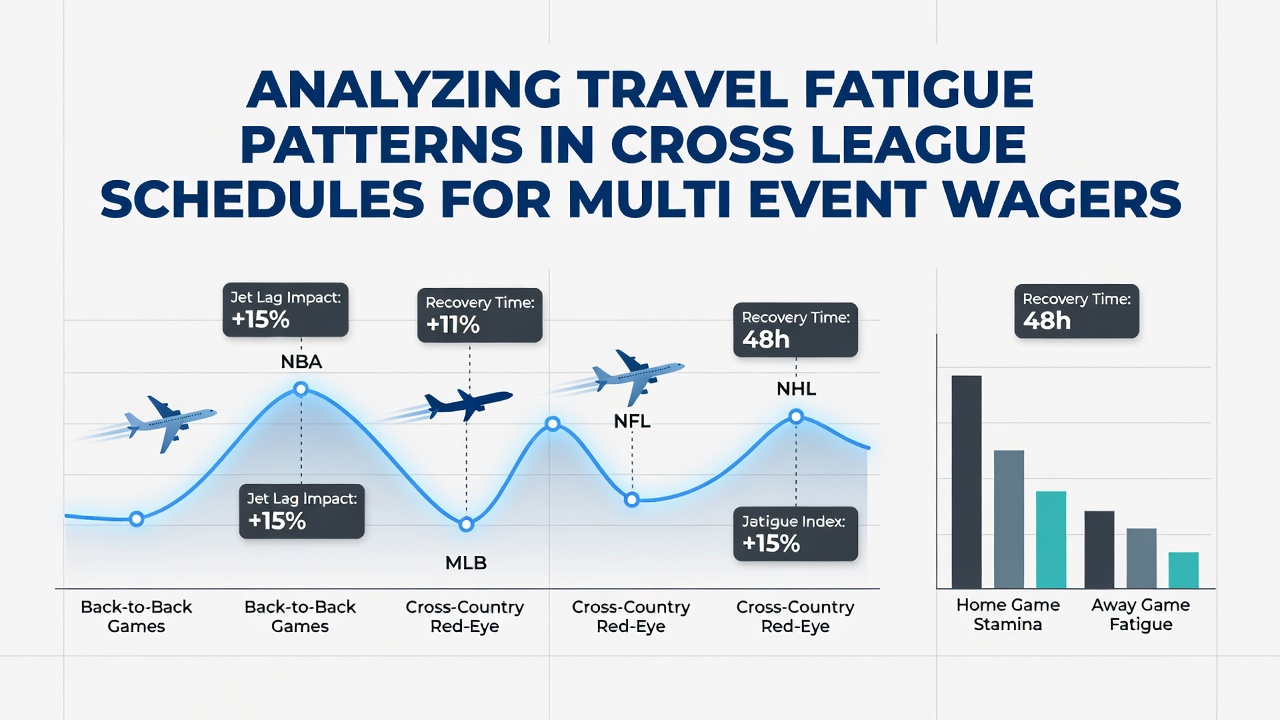
Travel fatigue emerges as a measurable factor when athletes move across time zones and league boundaries within compressed calendars, and data from multiple sports organizations tracks its effects on recovery times and performance outputs. Researchers compile flight logs, sleep metrics, and game results to identify recurring patterns where teams or individuals face back-to-back events separated by long-haul journeys, while multi-event wagers incorporate these variables into probability models that adjust for reduced output after extended travel.
Defining Travel Fatigue in Multi League Contexts
Cross-league schedules combine fixtures from domestic competitions with international tournaments or rival leagues that operate on separate calendars, and this overlap forces participants into rapid transitions between venues that span continents. Studies conducted by the Australian Institute of Sport quantify how circadian disruption accumulates when athletes cross more than three time zones within 48 hours, leading to documented drops in reaction speed and endurance markers that persist for up to five days. Observers note that these patterns intensify during periods when leagues coordinate joint events, such as exhibition series or qualification rounds that pull players away from their primary circuits.
Data Patterns Across Major Sports
Performance databases maintained by university research groups reveal consistent declines in scoring efficiency and defensive metrics following transcontinental flights in basketball and soccer schedules. One analysis of NBA and EuroLeague overlaps showed visiting teams recording lower field goal percentages when games occurred within 72 hours of arrival from overseas commitments, while soccer federations in Europe and South America report similar trends in player tracking data during Copa Libertadores and Champions League double-headers. In tennis, where players often juggle ATP and WTA events with national team duties, Grand Slam organizers track serve speed reductions that correlate with cumulative air miles logged between tournaments held in different hemispheres.
June 2026 marks the release of updated scheduling frameworks by several international bodies that aim to insert mandatory rest windows between cross-league obligations, and preliminary figures from pilot programs indicate modest improvements in recovery markers when minimum intervals reach 96 hours. These adjustments appear in calendars released for the following season, where federations align blackout dates to reduce simultaneous demands on shared athlete pools.
Implications for Multi Event Wager Construction
Betting platforms that aggregate outcomes across multiple events now integrate travel-adjusted algorithms supplied by sports analytics firms, and these systems recalibrate odds when participants appear in lineups after documented long-distance travel. Data sets from the Canadian Olympic Committee demonstrate how fatigue coefficients alter expected win probabilities in team events that span different sports leagues, prompting wager constructors to weight selections differently based on recent itinerary details rather than raw head-to-head records alone. Those who model accumulators examine flight manifests alongside performance baselines to identify instances where cumulative travel exceeds seasonal averages, thereby shifting projected totals or spreads in affected matches.
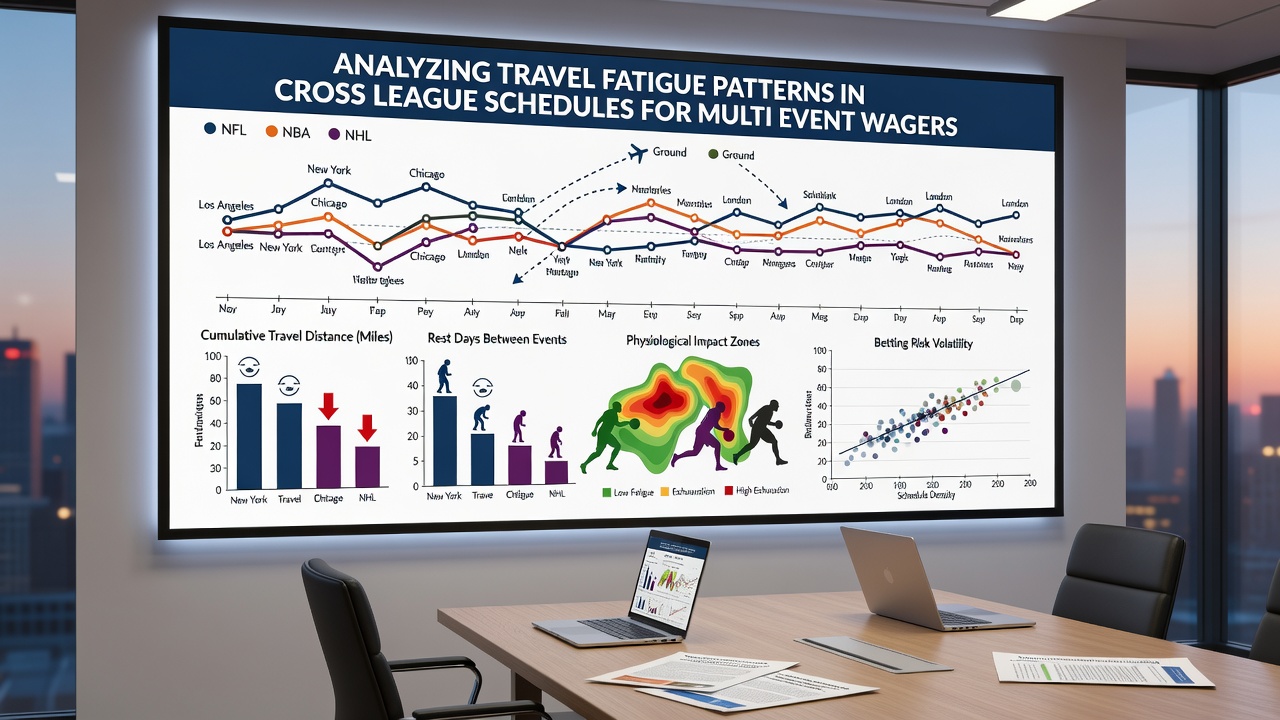
What's interesting emerges when schedules cluster events in rapid succession across geographically distant venues, because historical records show elevated variance in individual outputs during those windows. Researchers at institutions such as the University of Queensland have published longitudinal reviews that map these clusters against betting market movements, revealing that markets initially under-adjust for fatigue until sufficient historical precedents accumulate. The reality is that multi-event wagers spanning several days gain complexity when one or more legs involve participants who recently completed intercontinental journeys, since recovery timelines vary by age group and sport-specific demands.
Case Examples from Recent Seasons
Take the 2025 overlap between Major League Baseball and international baseball federation events, where several pitchers logged appearances in both circuits within a single week, and subsequent starts showed measurable increases in earned run averages that aligned with documented travel distances. Similar observations appear in rugby union schedules that interleave domestic premiership matches with cross-border tournaments, where forward packs exhibit higher tackle completion drops after long-haul travel according to GPS data compiled by national unions. Observers track these instances because they provide concrete inputs for refining wager models that incorporate fatigue variables rather than relying solely on venue or opponent strength metrics.
Future Scheduling Adjustments and Monitoring Tools
League administrators continue to explore software platforms that flag potential fatigue hotspots during schedule construction, and early implementations by North American and European federations have produced calendars with fewer consecutive high-travel fixtures. These tools draw on datasets that combine airline records with physiological monitoring outputs, allowing planners to simulate recovery curves before finalizing dates. In parallel, academic consortia publish annual summaries that compare fatigue incidence rates before and after such interventions, supplying fresh benchmarks for those constructing multi-event positions.
Conclusion
Travel fatigue patterns in cross-league schedules supply measurable inputs that influence both athletic outputs and the construction of multi-event wagers, with ongoing data collection efforts refining the precision of these adjustments. Organizations across regions continue to release updated analyses that link itinerary details to performance deviations, and these resources inform more granular approaches to schedule design and wager evaluation. As calendars evolve through 2026 and beyond, the integration of recovery metrics into predictive frameworks remains a central focus for researchers and analysts tracking these intersections.